“Then the storm broke, and the dragons danced.”
― George R.R. Martin, Fire & Blood
Athens, February 5th.
The most sunny country of Europe experienced a snowstorm in the first month of the year. And while there were no real dragons, a lot of people “danced” through the snow. It is something that folks rarely experience here.
There was chaos on the streets with accidents and traffic jams, people were slipping up and down the streets on the icy sidewalks, schools were closed and most people were happy, not to go to work.
For countries further in the north, it probably wouldn’t even be labeled as a storm and everything would just be business as usual, but here the situation is totally different. Cars have no winter wheels, people no winter shoes, there aren’t any specialized snow clearing vehicles, no snow shovels or other adequate equipment… and probably nobody here would know how to use it anyway.
It was fun though and the bright side is, that people were able to enjoy two days of additional vacation — and at least in Greece there isn’t any sign of climate change (sarcasm intended).
Likewise the Greek weather, the stock market also experienced a stormy January. There were many days with large market declines and although there was a significant rally during the last two trading days of the month, most stocks were down. The wildly held conception is, that interest rate hikes are on the horizon.
10-Year Treasuries and Market Indicators
Since the interest rate was the major financial news topic of the month, I will explore this topic more closely in the second part of this newsletter. In short, higher interest rates means lower stock valuations and a drawback for economic growth.
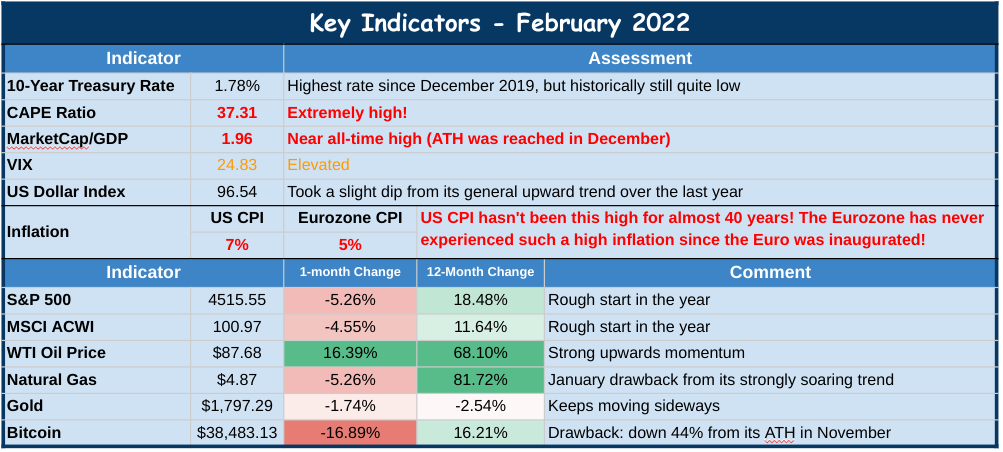
Lets first take a broad look at some key market indicators:
The above sheet presents the main indicators I tend to look at, to analyze the market.
Indicator Rundown:
What stands out is that CAPE Ratio, which looks at the cyclically-adjusted price/earnings ratio of the S&P 500, and the valuation of the whole stock market compared with the GDP (also called the “Buffet Indicator”), are both extremely high. Both of these indicators basically provide a hint of how expensive the stock market is from a historic perspective.
The VIX, often referred to as the “fear-gauge” is based on S&P 500 volatility and gives an idea about how much uncertainty there is in the market. At 24.83 it is quite high and indicates that there is a lot of uncertainty in the market. While a reading of 24.83 is historically high, it is not yet at a frightening level, such as reached during the 2008 crisis, or during the Covid-related crash in March 2020, in which the VIX went up to 60 and 54 respectively.
The stock market had a bad start in the year with the S&P down 5.3%. The NASDAQ even lost 9.5% and therefore experienced its worst January since 2008. Likewise, most other international stock indices were also down. The MSCI All Country World Index (MSCI ACWI) declined by 4.6%.
The oil price soared and keeps on its steep upward trend towards the $100 mark, which it didn’t cross since it had its huge crash back in 2014.
Along with the oil price, global energy prices keep rising, causing difficulties in several countries. At the moment, the most negatively affected are European countries, China and Kazakhstan.Bitcoin has had one of its worst starts in the year. At $38,483 It was down 44% from its all-time high back in November. Lately its short-term performance has reached a correlation to the NASDAQ of 0.6, which is a significant correlation and the highest in history. It seems to be seen by many traders as a risk-on asset comparable to technology stocks. It will be interesting to see whether this trend continues, but my guess is that these asset classes will decouple again in the future. Being quite knowledgeable and aware about Bitcoins price history, I remember several periods in which Bitcoin showed correlations to different asset classes, before decoupling again and following different patterns.
In this month’s letter, I want to explicitly focus on the first indicator (The 10-year Treasury rate), or rather interest rates in general. In future issues, I will elaborate on the other indicators, why I choose them and how they can be analyzed.
If I would be asked to pick only one indicator, to determine what is going on in the markets, I’d choose the 10-year Treasury rate. I think it is the most determining factor in the economy.
First, it is probably, next to the S&P 500, the mostly watched number in finance. Therefore, it serves as a comparison parameter for all other bond rates. In addition, it also serves as a proxy for mortgage rates. Furthermore, Treasuries have the highest market capitalization of all bonds and are also the most liquid. Having this in mind, the total market capitalization of the global bond market (estimated at around $120 trillion), dwarfs that of any other asset class. There is also an argument to be made that they are a gauge for the general investor confidence, as its moves provide a hunch at the perceived overall risk in the market. Lastly (and maybe most crucially), it is usually considered as the risk-free rate, hence, it is used for determining the economic viability of long-term business projects, as well as stock valuation (more on that later).
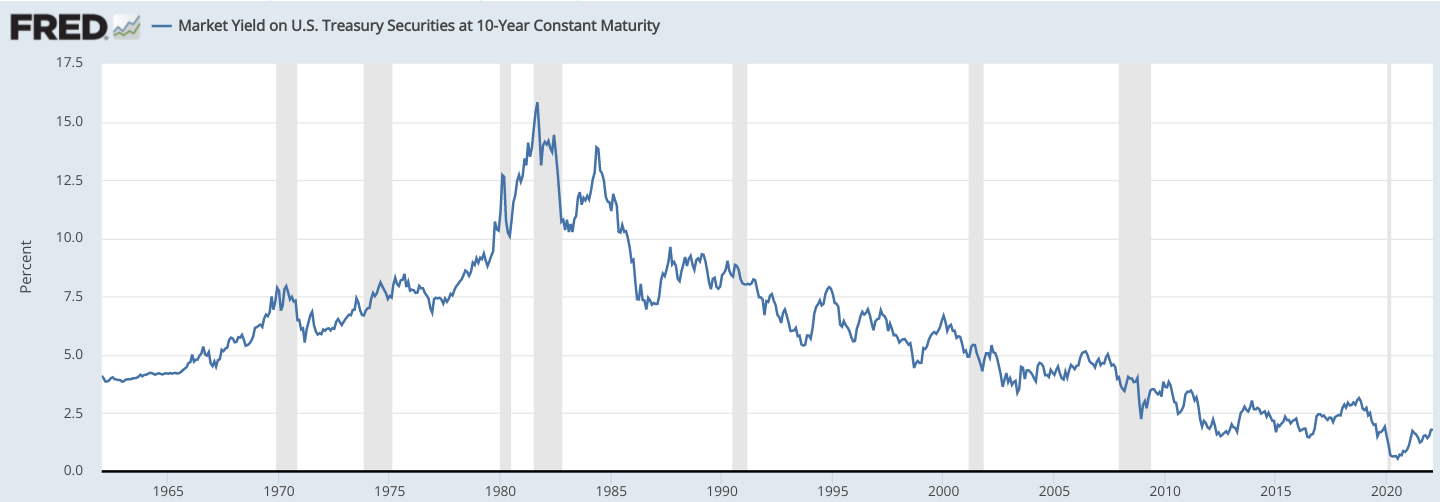
Here is a chart of the 10-year Treasury rate:
Chart Source: Federal Reserve Bank of St. Louis
We see that it has been in a downtrend since the early 80s.
Financial markets are complex and just looking at one indicator definitely isn’t enough to grasp what is going on. For instance, to just know the current 10-year Treasury rate doesn’t mean a lot without knowing the inflation that goes along with it. Therefore, financial analysts usually use a large variety of data sets which they look at. The opinions of which indicators are useful and how exactly to read and interpret them, vary a lot though.
The 10-year Treasury rate is considered as the risk-free rate because (a) it is the most liquid long-term bond, (b) the US dollar is the reserve currency, and (c) the Federal Reserve can always print the required amount of money to guarantee that the government is able to pay it back on the date of maturity — at least nominally.
However, it is not really risk free.
First, contrary to what some analysts say, there is a default risk. I agree that it is very unlikely to happen, however, it is not totally impossible that the U.S. government will at some point default on its debt. If that would not be the case, there wouldn’t be a credit rating for them (currently at AAA).
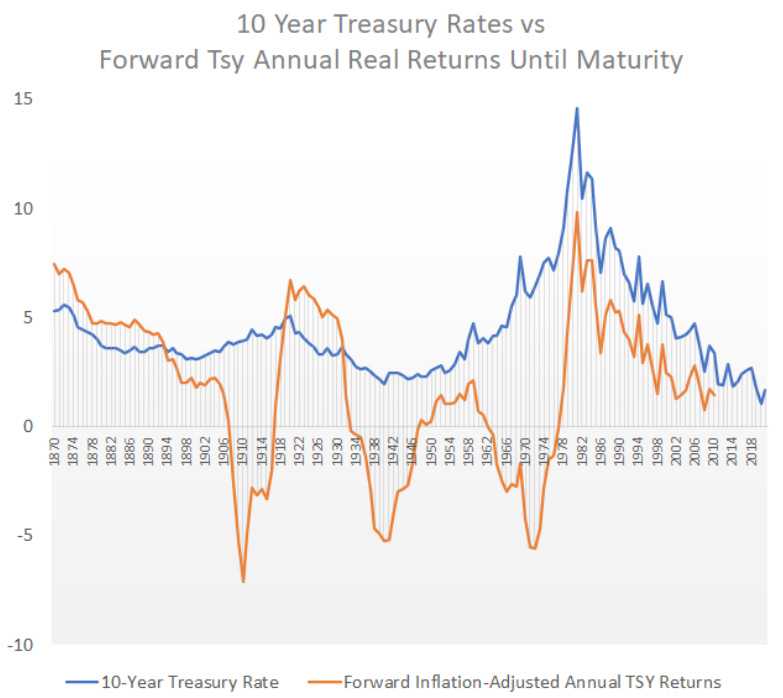
The most crucial risk that underlies Treasuries is inflation. Each holder of a Treasury has the risk that inflation goes above the treasury rate at his purchase date. As soon as it does, there is the potential of a negative return, which depends on how long the inflation stays above it and how high the spread is. In the case of a hyperinflation, the potential loss goes up to 100%. But even if there is just a longer period of high inflation, a 10-year Treasury note can yield a negative return. The historic chart below proves this point:
Chart Source: LynAlden.com
Data Sources: https://www.macrohistory.net/, Federal Reserve Bank of St. Louis
The blue line shows the 10-year Treasury rate shown before, but going back until 1870. The orange line is the forward inflation-adjusted return of these Treasuries. It shows the return you would have made if you bought the 10-year Treasury note and held it until maturity. We can see that during all three inflationary decades in the United States, Treasury investors had substantial negative returns. Not so risk-free after all.
As I explained in the January issue, I believe that we might have a long period of high inflation ahead of us. Thus, I see a high probability that when the chart gets updated 10 years from now, the orange line will be in the negative area for 2022. And while I have focused the analysis here mainly on the U.S. market, most countries are in similar circumstances. Assuming that inflation stays at the current 7% over the next decade and you bought a Treasury at the current rate of 1.78 and hold it until maturity, your return on investment would be -5.22%. Congratulations. Maybe you will get more lucky next time.
Thus, I think investing in government bonds is one of the worst — and most risky — long-term investments to make at the moment. For those who still do, the government thanks you for your donation.
We can conclude, that even the 10-year Treasury rate is not totally risk-free and, alongside a small possibility of a government default, inflation is the main factor imposing some risk on it.
FED Interest Rate Policy and Inflation
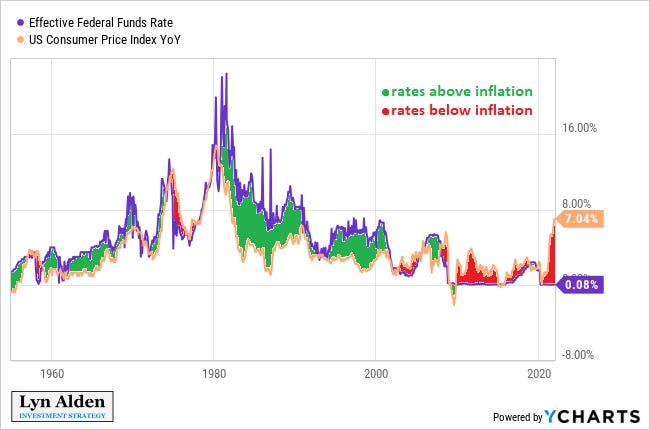
The following chart shows the Federal Funds Rate in comparison to the CPI:
Chart Source: Federal Reserve Bank of St. Louis
In the late 70s, America experienced economic turmoil accompanied by high inflation. In order to combat inflation, Paul Volcker, at the time Chairman of the Fed, raised rates to a record of 20%. Since then we are in a long-term cycle, in which central banks have constantly pushed interest rates lower.
We see that the interest rate has been close to zero basically since the 2008 Financial crisis, with an exception between 2015 and 2018, in which the Fed started to raise rates, but reversed this policy after the S&P 500 fell more than 9% in December of 2018.
We also see that the inflation has spiked up in 2021, reaching 7% (as measured by CPI) — the highest rate since almost 40 years.
Historically, it is rare that the interest rate is below the inflation rate, and we are now experiencing the highest spread between them since the 40s:
Chart Source: Lyn Alden
For this reason, the first meeting of the Federal Open Market Committee (FOMC) of the year was highly anticipated. The big question on everyone’s mind is, whether the the Federal Reserve is determined to tighten its monetary policy, in order to fight inflation.
Here is the opening statement of Jerome Powell’s announcement:
At the Federal Reserve, we are strongly committed to achieving the monetary policy goals that Congress has given us: maximum employment and price stability.
Today, in support of these goals, the Federal Open Market Committee kept its policy interest rate near zero and stated its expectation that an increase in this rate would soon be appropriate. The Committee also agreed to continue reducing its net asset purchases on the schedule we announced in December, bringing them to an end in early March.
— Jerome Powell, Chair of the Federal Reserve, January 26, 2022
Since the Federal Reserve Act in 1913, the Federal Reserve is responsible for setting the interest rate policy in the United States. It therefore has 3 main tools:
Reserve Requirements: Regulating the amount of reserves that banks have to hold in relation to their deposits.
Discount Rate: It is the rate the Fed charges on its loans to financial institutions.
Federal Funds Rate & Open Market Operations: The Federal Funds Rate has been the main tool to implement monetary policies over the years. It is the overnight lending rate between banks (e.g for meeting the reserve requirements). The FOMC sets a target rate (currently 0 - 0.25%) and it implements this rate by going into the open market and buying (or selling) U.S. government securities from banks.
In regards to the high level of inflation, Powell went on to reassure that the Fed is committed to their mandate of price stability:
Inflation remains well above our longer-run goal of 2 percent. Supply and demand imbalances related to the pandemic and the reopening of the economy have continued to contribute to elevated levels of inflation. In particular, bottlenecks and supply constraints are limiting how quickly production can respond to higher demand in the near term. These problems have been larger and longer lasting than anticipated, exacerbated by waves of the virus.
[…] We understand that high inflation imposes significant hardship, especially on those least able to meet the higher costs of essentials like food, housing, and transportation. In addition, we believe that the best thing we can do to support continued labor market gains is to promote a long expansion, and that will require price stability. We are committed to our price stability goal. We will use our tools both to support the economy and a strong labor market and to prevent higher inflation from becoming entrenched.
So it seems like the Fed is actually committed to stop their net asset purchases and start to raise rates in March by 25 basis points. It is further anticipated that there will be 3-4 rate hikes in 2022, which would bring the rate to about 1%.
Market Turmoil and Sector Rotation
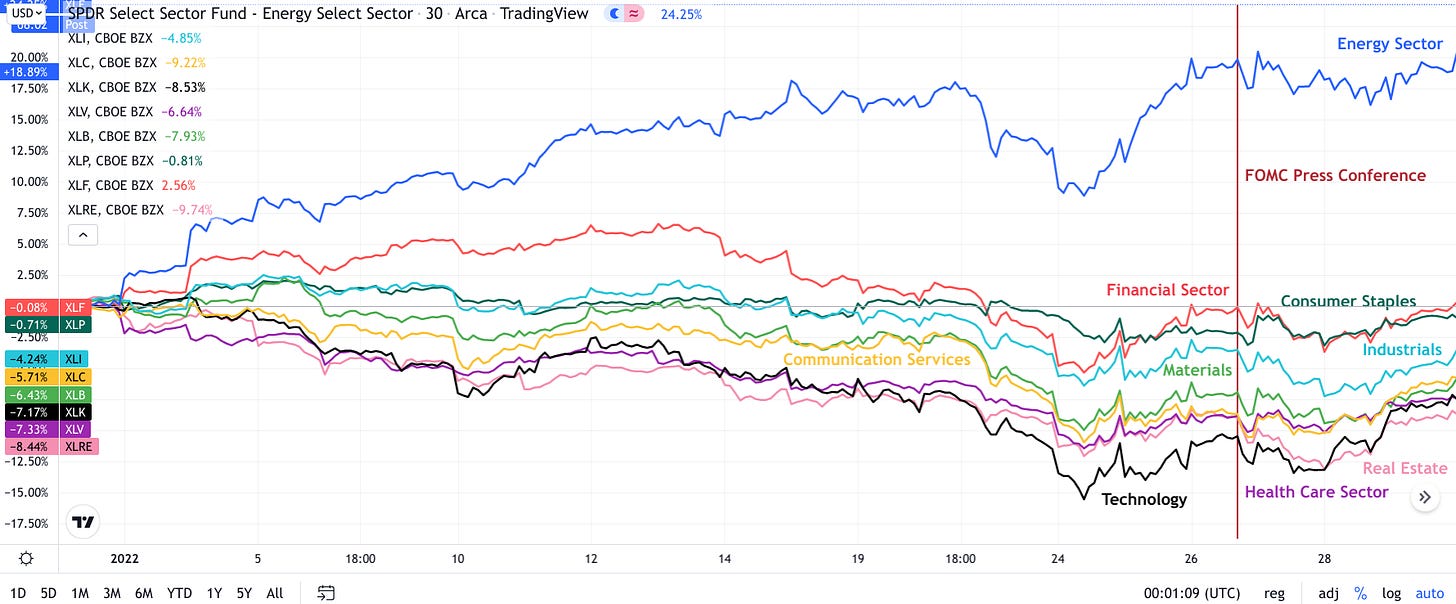
Even though the Fed hasn’t even started raising the rates yet, and a 1% interest rate is obviously not very high — especially in the face of a 7% inflation rate — the reaction is already becoming obvious with high stock market volatility, in anticipation and after Powell’s announcement.
The following chart shows the January performance of different sectors:
Chart Source: Own Chart via TradingView.com
In addition to the general volatility, there has also been some rotation between sectors: Like I quickly mentioned in last months newsletter, there is some attention on a trend reverse from the growth stocks towards the value stocks, which is also mainly influenced by future perspectives of the interest rate.
I will elaborate on the exact influence of the interest rate in the second part of the newsletter. Suffice it to point out that the stocks that have been down the most, in anticipation of rate hikes, have been technology stocks, stocks in the health care sector, as well as real estate. All these sectors are very long-term oriented. If borrowing money becomes more expensive, projects that will generate returns in the distant future, become less attractive and anticipated future cash flows become less valuable in the present.
In addition, we see a tremendous rise in the energy sector, driven by spikes in oil prices.
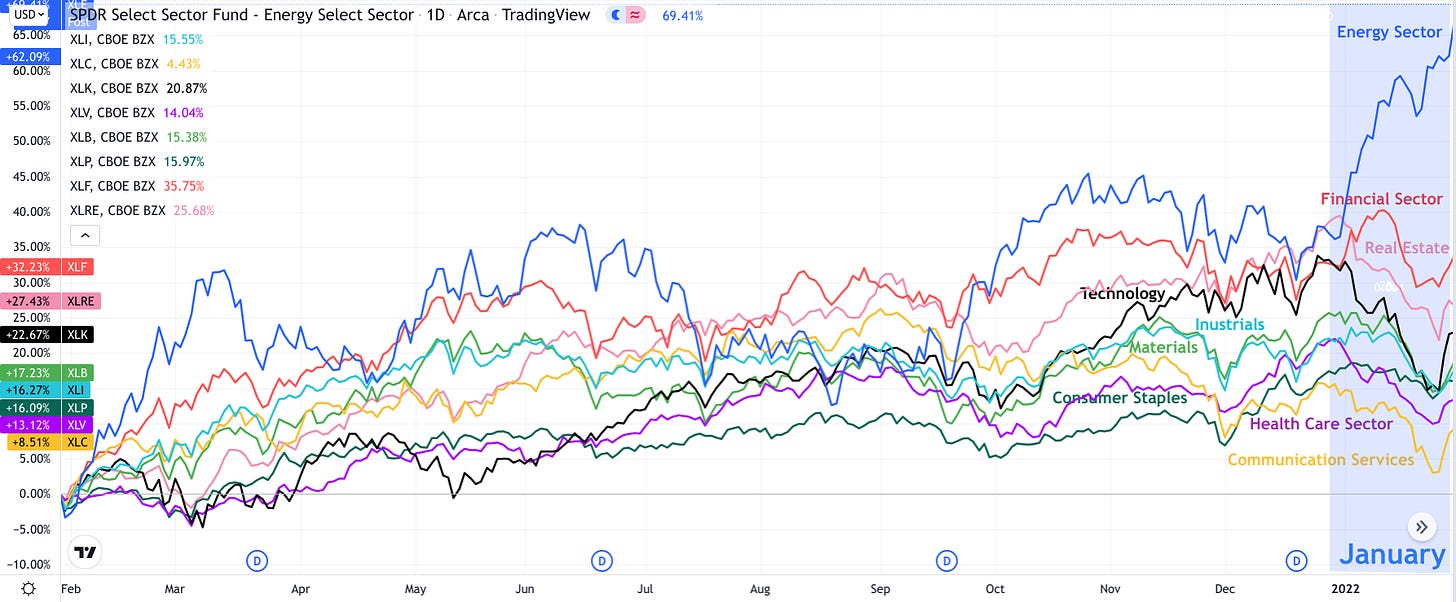
The next chart gives some idea about the sector rotation. When zooming out a bit and looking at it from a 12-month perspective, it becomes obvious how the energy sector has started to outperform all the other sectors:
Chart Source: Own Chart via TradingView.com
I have stated in the January issue, that I am quite bullish on the energy market over the next decade and expect it to go up a lot. However, I expect that it is not gonna be a straight upwards sloping line. The energy market is traditionally volatile and I think there will be substantial drawbacks on the way up. Such massive moves, like we have seen over the past view weeks, could give some caution on the short-term price performance. But medium- to long-term, I expect huge increases.
If we zoom out even more and look at a 5-year chart, we can get an even clearer idea about the sector rotation. Some analysts argue that this is just the beginning of a huge shift (especially those analysts and investors who like value stocks, don’t like technology stocks and have been terribly wrong over the last decade):
Chart Source: Own Chart via TradingView.com
The technology sector has outperformed all other sectors by a huge margin (with a return of 230%), while the energy sector has been underperforming substantially (-8.5%). It is basically the total reverse of recent market developments. All other sectors are ranging between 40% and 91% gains over 5 years.
The chart also shows how the health care sector has had a huge rise, in comparison to the other sectors, just after the Covid market collapse in March 2020. However, while it has been the second best performing sector over the 5-year time frame, the divergence has been declining a bit since then.
I am not so sure whether the rotation towards value stocks will last long. I think it depends a lot on the Fed policy. If rates actually rise, then yes. If the Fed goes back to stimulating and pushing rates down, then I tend to think that the trend will reverse accordingly. In general I think, that growth stocks are more overvalued than value stocks.
International Implications of FED Policy
The U.S. dollar is the major currency, the U.S. has by far the largest government bond market and U.S. companies represent more than 50% of the global stock market.
Therefore, the decisions made by the Federal Reserve impact not only the U.S., but what they do has significant global impacts. This is the main reason why every financial analyst around the world is paying attention to the Fed’s monetary policy.
Further, interest rates, as well as global stock market trends tend to follow the U.S. market. For instance, if the U.S. stock market closes with a huge decline, it is normal to also see stock market declines in the Asian markets as soon as the Tokyo stock market rings the opening bell.
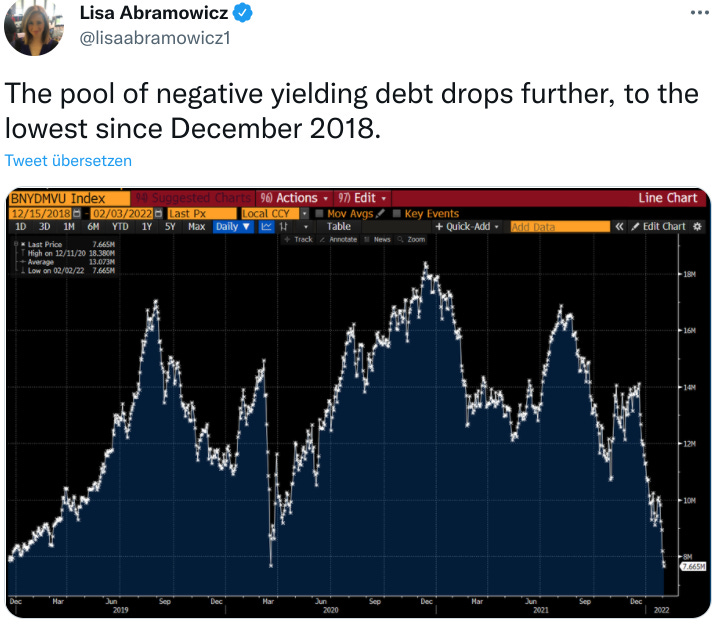
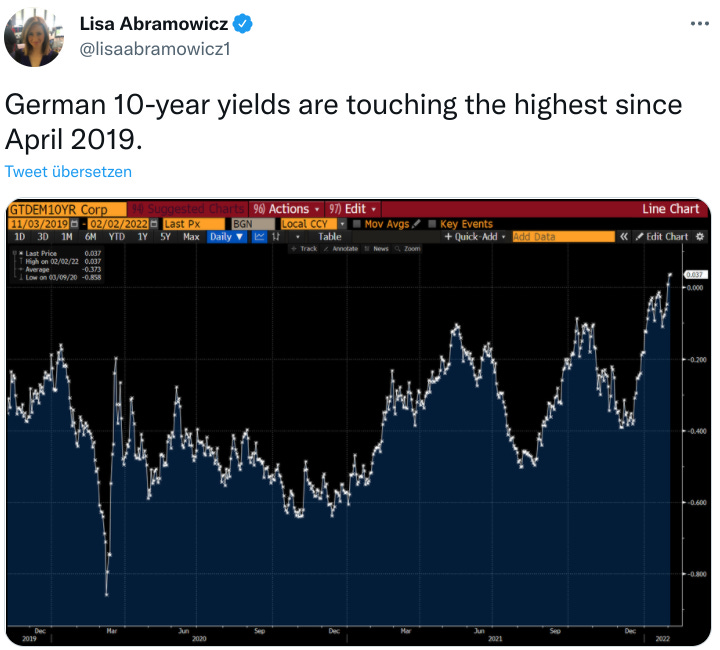
And the effects that Fed announcements have on global interest rates is similar. It also means, that some of the huge amount of the negative yielding bonds in Europe and Japan, come back above the zero percent line.
Courtesy to Lisa Abramowicz, for pointing this out:
…and that…
Thus, we see that the interest rates in other countries also tend to rise and decline in close correlation with the American rates.
Shrinking the FED Balance Sheet
Coming back to the U.S. monetary policy.
Later in his speech, Powell also mentioned that it remains a goal to decrease the Fed’s balance sheet in the future:
To provide greater clarity about our approach for reducing the size of the Federal Reserve’s balance sheet, today the Committee issued a set of principles that will provide a foundation for our future decisions. These high-level principles clarify that the federal funds rate is our primary means of adjusting monetary policy and that reducing our balance sheet will occur after the process of raising interest rates has begun. Reductions will occur over time in a predictable manner primarily through adjustments to reinvestments so that securities roll off our balance sheet.
To summarize it all, here are the steps that the Fed currently intends to do, to implement its monetary strategy:
Reduce net asset purchases of Treasuries and mortgages to zero by March
Start raising the federal funds rate by 25 basis points in March and keep raising them until the price level is stabilized
At some unspecified point, start with not rolling over some of the held securities, so that the balance sheet will decline
Powell also stipulated several times that the Fed’s decisions remain data dependent and are constantly evaluated. Hence, they are not signaling any determination to hold on to their strategy, but rather imply that they are up for change at any time.
My opinion is, that the Fed will not be able to reduce their balance sheet, at least not significantly. My bet would be that they will be able to do step 1, but given the huge debt burden and enormous leverage in the financial system, there will be a lot of pressure to reverse course. And since they dependent on unspecified data — and not on economic principles — they will find it easy to find some reason to reverse policy during step 2. And I think rather sooner than later. Today’s whole financial world depends on credit expansion and it cannot keep going without it for long.
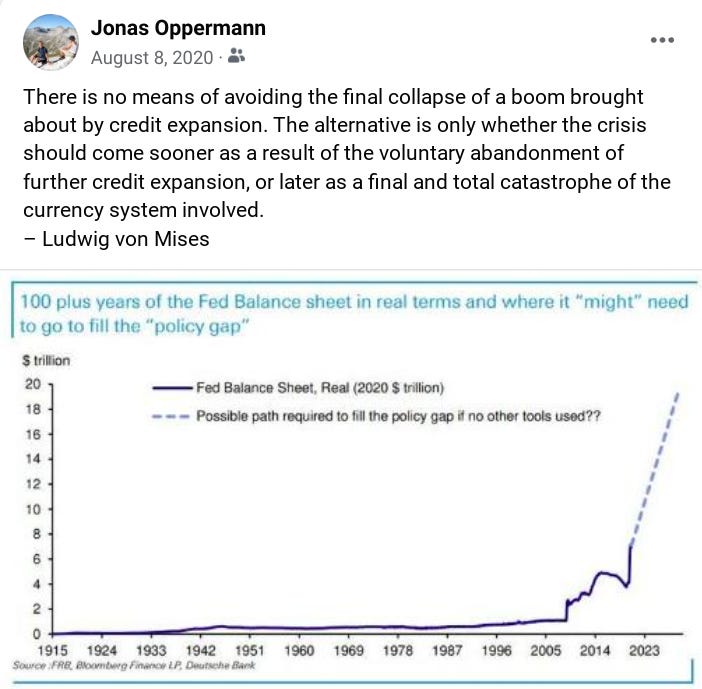
Here is a Facebook post I made back in August 2020 (actually my last FB post):
So far, about one and a half years later, we can confirm that the Fed has been keeping up with the dotted line quite well… and I assume it will continue to do so.
To understand the Mises-quote and the reasoning behind it, this months’s educational section will look at the most important price in a market economy, which can be expressed as the time value of money, or, the coordinator of time preference, or, the interest rate.
The Importance of the Interest Rate
This is the part of the newsletter in which I do a deep dive into a specific topic. Every month, I write about one relevant topic and try to provide some educational information about it.
This week we are going to look at the interest rate and explore why it is so crucial for financial markets, as well as the general economy.
Perhaps more fallacies have been committed in discussions concerning the interest rate than in the treatment of any other aspect of economics. It took a long while for the crucial importance of time preference in the determination of the pure rate of interest to be realized in economics; it took even longer for economists to realize that time preference is the only determining factor. Reluctance to accept a monistic causal interpretation has plagued economics to this day.
— Murray N. Rothbard (Man, Economy, and State)
Time Preference
Time preference is one of the most important concepts in economics.
In short, it is the expression of how individuals value the presence versus the future. Someone who values the present over the future, has a high time preference.
In contrast, someone who’s focus is on the long-term, expresses a low time preference.
Saifedean Ammous gives an eloquent description of the concept:
While microeconomics has focused on transactions between individuals, and macroeconomics on the role of government in the economy, the reality is that the most important economic decisions to any individual’s well-being are the ones they conduct in their trade-offs with their future self. Every day, an individual will conduct a few economic transactions with other people, but they will partake in a far larger number of transactions with their future self. The examples of these trades are infinite: deciding to save money rather than spend it; deciding to invest acquiring skills for future employment rather than seeking immediate employment with low pay; buying a functional and affordable car rather than getting into debt for an expensive car; working overtime rather than going out to party with friends. [...] In each of these examples, there is nobody forcing the decision on the individual, and the prime beneficiary or loser from the consequences of these choices is the individual himself.
— Saifedean Ammous (The Bitcoin Standard)
[Note: “The Bitcoin Standard” is in my opinion the best book about Bitcoin. It goes through the history of money and looks at all the important aspects of money that need to be considered. It provides a great historical context from a perspective of monetary evolution, as well as Bitcoin’s prospects as a future global settlement system. My favorite chapter is the one about time preference (chapter 5), which can be read as a stand-alone essay. If anyone is interested, Ammous has provided the PDF version for free and it can be read here.]
So each individual makes numerous choices everyday which are all, in some form or another, an expression of our time preference. Those choices involving financial decisions are the ones that (in a free market) determine the interest rate. And the given interest rate, in turn, influences the decisions we make.
It is also often termed as the time value of money, because the interest rate is an objective statement, of how much a society values holding money in the present over having it in the future.
When people decide to save money, and thereby forgo immediate consumption, the interest rate will tend to go down, for there are now more savings available for people who want to borrow money. More supply given the same demand level, will lead to a decline in the price to borrow.
On the other hand, if people choose to spend money immediately, instead of saving it, the interest rate will tend to rise, since the money remains in circulation and borrowers are now faced with less available funds.
It follows that as the interest rates fall, more people will be incentivized to borrow or consume money and less people will be incentivized to save it. Likewise, a rising interest rate will lead to a higher motivation to save and a lower incentive to borrow.
Thus, in a free market economy, where individuals can freely express their choices, according to their time preference, the interest rate will tend to a natural equilibrium.
In contrast, if the government steps in and — in various ways — interferes with this natural process, the interest rate becomes artificial.
While the market forces will still remain, the artificial interest rate will influence the incentive structure. The time preference will adjust accordingly and people will make different choices than they would have done otherwise.
Stock Price Valuation
One aspect where this becomes obvious is the stock valuation.
The Discounted Cash Flow (DCF) model is one of the basic models that every business and finance student learns.
In recent years, there is a trend to rely more and more on technical analysis, momentum and short-term oriented trading strategies. However, basic value concepts are still crucially important, especially when it comes to all of the projects that are undertaken within a company.
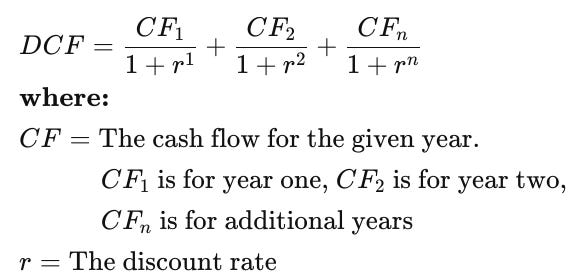
In essence, DCF is a method that is used to evaluate the present day value of an investment. It does so by projecting future cash flows, that the investment is expected to generate, and then discount them back to the present.
Formally it may be expressed as follows:
This model serves as the basis for a whole set of more complex models developed by financial institutions to evaluate their investment decisions.
There is no specified norm for the discount rate, and in practice there is a lot of variation in what specific rate is actually applied. In finance textbooks it is usually the risk-free rate, hence the rates of short-term Treasury bills or the 10-year Treasury note.
The crucial part to understand is, that whether it is the 10-year Treasury rate, or the average cost of capital, every rate that will be chosen, is in correlation to the interest rate, which is set by the Fed. It follows, that each change in it will affect the profitability of the investment. The implications of this are enormous.
To illustrate it, lets apply it to a quick example.
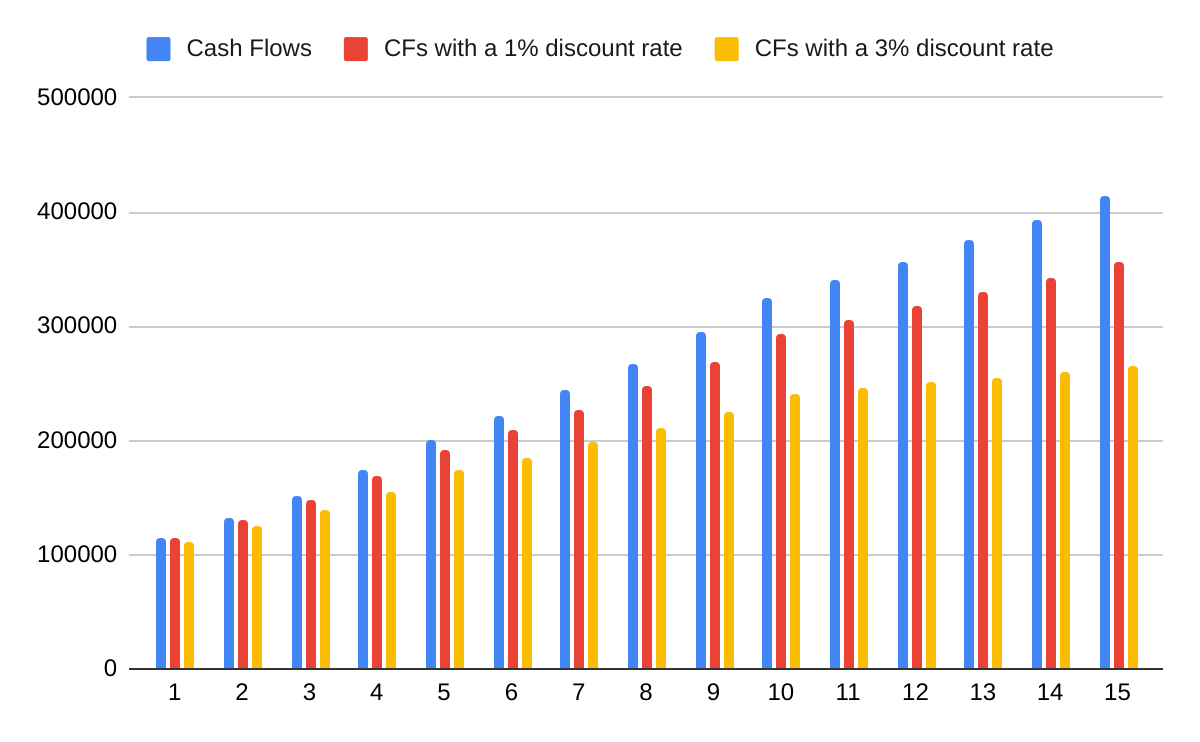
Let’s say you consider investing in company that has a current cash flow of $100,000. It is a quickly growing technology start-up, so after doing your research you estimate that it will grow at 15% for the next 5 years, it will continue growing at 10% for the next 5 years and it will grow at 5% for the remaining 5 years. To simplify it, lets leave it at that.
Now, let’s consider two scenarios: In one scenario the applied discount rate is 1% and in the other scenario it is 3%. The cash flows look as follows:
Your DCF for scenario one is: $3,645,669.41
And the DCF for scenario two is: $3,042,857.26
The company currently has 100,000 outstanding shares. Thus, according to your valuation model, one share is worth $36.5 in scenario one, or $30.4 respectively in scenario two.
A stock decline from $36.5 to $30.4 means a negative return of -16.5%
So, if you operate under scenario one and buy the stock and now the interest rates start rising, so that the appropriate discount rate changes from 1% to 3%, your stock has lost 16.5% of its value. Congratulations!
This provides an explanation of why the stock market is so sensible to even hearing about potential rate hikes. The current total stock market valuation in the U.S. alone is over $50 trillion. And most of it sits in technology stocks, which are most affected by interest rate changes.
Now imagine a scenario in which the Fed would really get serious to fight for price stability. In order to get ahead of inflation they would need to raise rates to lets say 8% (Paul Volcker raised rates to 20% to do that in the 80s). In the above illustrated scenario, a discount rate of 8% would mean a decline in the stock valuation of 44.6%.
There is one more important aspect to mention here. It is not only about companies with positive cash flows (like our example). There are a lot of highly valuated companies that aren’t even profitable at the moment. Their valuation is based purely on future expectations. But they are in debt to finance their operations and therefore highly leveraged. For these companies, rising rates are even more detrimental and could lead to bankruptcy.
These companies and investors will put a lot of pressure on the government and the Fed, to not let that happen, keep interest rates low, and continue with stimulating.
Actually, I think that all of the recent crazy market developments and investment behaviors have their roots in the artificially low interest rate, which brings about the abundant availability of cheap money and a high time preference. For instance, in the previous issue, I brought up some of the crazy developments that are happening, such as AMC, Gamestop, or insanely priced NFTs.
These examples are just the tip of the iceberg. The whole financial system has become much too big, increasingly unattached to fundamentals and the underlying economy. But nevertheless, its functioning is necessary for the economy to operate and since it doesn’t function accurately anymore, the whole system is in deep trouble.
I think most people, even folks who are not particularly interested in finance, have it in their guts that something is wrong. They can feel that there is something wrong with our financial system.
As I gonna keep repeating throughout the rest of this letter, I thoroughly believe that a pure natural interest rate, based on time preference, is paramount for a healthy economy!
Centrally planned tinkering of it, in contrast, poisons the whole economy. When the reliability of the denominator and therefore the ability to accurately make economic calculations is destroyed, then you get funny results.
The Austrian Theory of the Business Cycle
The question why we have booms and busts is actually what first got me somewhat interested into economics back in 2008. I was going to high school at the time and it astonished me how some housing crisis in America can cause such a devastating effect on the whole world. I was wondering how this can all be so interrelated.
The occurrence of booms and busts in the economy are a very highly debated topic in economics. Some argue that boom and bust cycles are somewhat mysterious market phenomena, that will periodically happen, but there is no accurate way to foresee, why, when and how they will occur. Some economist say that while booms and busts happen, there are no underlying cyclical structures that can be observed. Others argue that while these cycles exist, there are no specific factors that can be identified for their causation. Communist or socialist leaning economists usually blame it as an expectable outcome of a capitalist system. Keynesian economists look at it as an insufficient “aggregate demand” (a lack of overall consumption), a phenomenon caused by the “animal spirits” of market participants. One school that has a somewhat explanatory theory, are the monetarists (also known as Chicago School). They recognize quite well, how monetary expansions impact overall prices and, if overdone, will lead to a crisis. However, they fail to acknowledge the capital structure and how monetary expansions will have different effects on different sectors over time. For this reason, even their theory doesn’t provide a satisfactory explanation.
The Austrian School of Economics has in my opinion — and, as far as I’m concerned, this is also supported by historic events — by far the best explanation.
As a quick side note, the Austrian School has not much to do with the country of Austria. The reason it got this name is just that the first main economists, promoting this school of thought, happened to be from Austria.
The Austrian Theory of the Business Cycle was fist publicized by Ludwig von Mises in “Theorie des Geldes und der Umlaufsmittel” in 1912 (The English version “The Theory of Money and Credit” was published in 1934). According to this theory, booms and busts are not just a mysterious market phenomenon, but rather that there exists a clearly definable causation of it.
In a nutshell, the theory says that credit expansion will lead to an artificially low interest rate, which, in turn, will lead to wrong signals for market participants: On the one hand, consumers will be triggered to spend more and save less. On the other hand, companies and investors are incentivized to lend more and engage in investments. This will lead to a boom, since there is an increased amount of consumption and investments — or in Mises words, overconsumption and malinvestments.
Since there is a mismatch of incentives and only a specific amount of resources available, this process is not sustainable and must finally end in a bust.
Mises argued, that the bust is actually something that should not be seen as something negative. It is the phase of the business cycle, where the market corrects all the misallocations and gets back to a natural and sustainable state. In contrast, the boom is the problematic phase, where all the mistakes are being made.
Moreover, the way in which the funds are invested during the boom is also critical and requires an understanding of the capital structure.
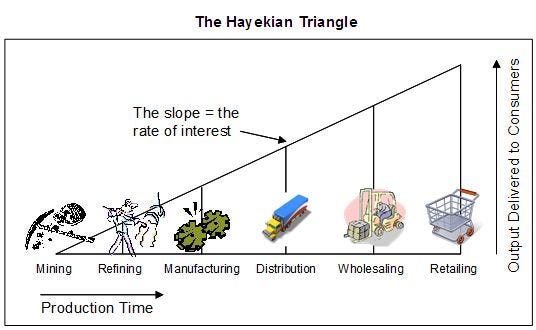
In 1935, the Austrian economist and Nobel Prize winner Friedrich A. Hayek, presented the following triangle diagram, to describe the capital theory on the different stages of production:
Diagram Source: Alhambra Investments
The triangle shows how the different stages of production are in relation to their production time. The crucial aspect of this triangle is that the slope of the triangle represents the contribution of the interest rate to the production structure.
If the interest rate is lowered, the slope of the triangle will tend to flatten, allowing for more production stages and a broader capital structure. On the other hand, if interest rates go up, the triangle will tend to steepen. Consequently, less long-term projects will be undertaken and the production structure will put a stronger focus on consumption goods.
This also explains why some sectors, like real estate, technology and health care, are more negatively influenced by rising interest rates than other sectors (as we have seen in the January stock movements). These sectors have a more widespread capital structure, requiring a longer production time.
In general, the more productive an economy becomes, the wider the capital structure will become. Therefore, developed economies also tend to have more complex capital structures, allowing for more efficient processes and the development of more sophisticated products.
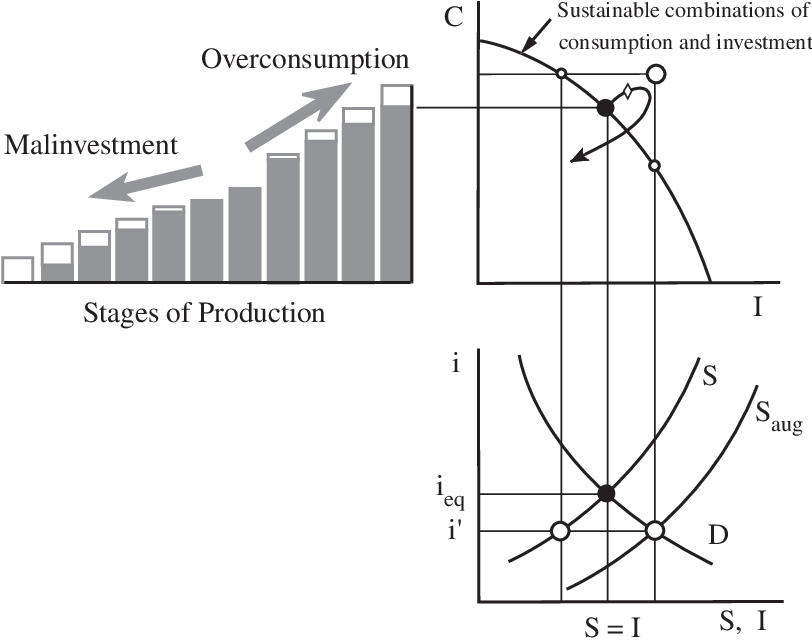
Now, for everyone who is still following, let’s get a bit more technical:
Figure Source: Garrison, R.W. (2004). Overconsumption and Forced Saving in Mises-Hayek Theory of the Business Cycle. History of Political Economy 36(2), 323-349. https://www.muse.jhu.edu/article/169088.
Everyone who took economic classes should immediately recognize and be able to read the graph on the bottom right side, maybe even make sense of the graph on the upper right. And the remaining one is our Hayekian Triangle. I’ll try my best to explain them and how they are interrelated. [if the figure is too complicated, I hope it is possible to get the important idea just through reading the text]
The graph on the bottom right side shows the supply “S” and demand “D” for available funds. Available funds are the savings “S” which are available for investments “I”. Hence, “S” = “I”. Whereas the demand “D” is basically a representation of the time preference. “i” is the interest rate. The natural equilibrium point is the black dot at the intersection of “S” and “D”.
When the natural interest rate “i(eq)” is artificially pushed down to “i(’)”, there is an incentive to save less and to invest more. Hence, the intersection of “D” and “S(aug)” represents the investments (I) that will be made, while the intersection of “D” and “S” represents the available savings. The divergence of these, is what finally leads to the unsustainability of this state.
We can now look at the upper right graph. The convex shaped curve shows all the sustainable allocation scenarios for consumption “C” and investments “I”. In other words, there is a certain amount of funds available, which can either be spend on consumption goods, or invested in capital goods for future consumption. Note that every point which is on the upper-right site of this curve is unsustainable, because there are not enough funds available in the economy at the given moment. Simply speaking, if you have $10,000 and you consume $6,000 of it, there will only be $4,000 left to save and invest. On the other hand, every point inside the curve is an inferior point, where some possible opportunities are forgone.
The location of the black point is exactly determined by the black point of the “S” and “D” intersection of the bottom right graph. It therefore shows the allocation that would occur given the natural interest rate “i(eq)” and the current time preference.
Let’s turn to the Hayekian Triangle next. As you can see, the black point on the sustainable consumption & investment curve is exactly at the level of the final production stage of the naturally established production structure (represented by the grey bars). This would be the natural state of the economy.
How does an economy grow naturally?
What happens is, that those resources, which are not consumed but invested, will over time lead to a healthy economic growth, which is sustainable and not followed by a bust. In the figure this would result in a sustainable consumption & investment curve that over time shifts to the upper right and an accordingly growing triangle of the production stages.
Bear also in mind, that a lowering in time preference will result in a downward shift along the sustainable consumption & investment curve, resulting in less consumption and more investment. This will lead to a higher rate of growth. A higher time preference will, in contrast, result in more consumption and a lower growth rate.
What we can say from this analysis is that in a totally free economy there is no reason for a boom and bust cycle to occur. Individuals are of course always prone to mistakes and wrong judgments, hence there would always be some occasional spikes and downturns. But it is very unlikely that they could occur to the enormous extend that we have experienced over the last century and are witnessing now.
So far we haven’t fully concluded, how the artificially low interest rate is manifested in the upper two graphs. In the upper right graph, we can see that the big white dot is way outside of the sustainable consumption & investment curve. It is therefore a position that cannot be sustained in the long-run. However, given the artificially low interest rate, this is the way in which individuals and entities are incentivized to behave: To companies it appears that long-term projects and investments in the lower stages of productions are profitable. The consumers on the other hand, are incentivized to spend their money on consumption goods, instead of saving for the future. It follows that there is too much consumption and investments, given that the savings are too small to justify it.
In the production structure this behavior is illustrated by the white addition to the bars. It shows that there is an overconsumption on the right side of the triangle and malinvestments on the left side of the triangle.
The final result is indicated by the 180° bent arrow in the upper right chart. It pushes towards the unsustainable big white dot. But since there are not enough resources to finalize all the investments, especially the ones in the lower production stages, they can never all fully come to fruition. Therefore, the desired white dot is never completely attained. At some point there has to be a bust, to correct the misallocations. And the arrow shows that the downturn will not simply stop at the sustainable consumption & investment curve. To sort out all the misallocations and return to a productive state of the economy, there is some suffering to go through, a depression, which means that for some time the level of consumption and investment will be below the previously attainable curve.
Bringing it back to the current economic situation, I think that we are currently in the final stages of a massive bubble. Due to enormous government and central bank interventions, interest rates have been pushed down to tremendously low levels for many years. This, in turn, has caused continuous overconsumption and massive amounts of malinvestments.
The End Game
This brings us to the final question. If we are in such an economic bubble, imposed by artificially low interest rates, then how can the situation continue? I think that there are basically two options.
Option one is to seriously raise interest rates and fight the inflation. This should result in a serious economic depression, most likely way more severe than the 2008 financial crisis.
The second option is best described by Murray Rothbard:
Why do booms, historically, continue for several years? What delays the reversion process? The answer is that as the boom begins to Peter out from an injection of credit expansion, the banks inject a further dose. In short, the only way to avert the onset of the depression-adjustment process is to continue inflating money and credit. For only continual doses of new money on the credit market will keep the boom going and the new stages profitable. Furthermore, only ever increasing doses can step up the boom, can lower interest rates further, and expand the production structure, for as the prices rise, more and more money will be needed to perform the same amount of work. Once the credit expansion stops, the market ratios are reestablished, and the seemingly glorious new investments turn out to be malinvestments, built on a foundation of sand.
— Murray N. Rothbard (Man, Economy, and State)
So which of these two scenarios will the Fed (and other central banks) likely pursue?
My guess is that the second option is way more likely. There is just too much political pressure, to (a) not let the stock market significantly decline and (b) to support the economy against any serious deterioration.
I think, they probably will start raising rates, to keep some of their credibility and to signal that they are committed to honor their price stability mandate. However, once the stock market has declined to a painful extend, they will ultimately stop the tightening process and revert to — aggressively — accommodate the economy.
Thus, I believe that we will see magnificently bigger stimulus packages in the future.
And at some point, we might also find out, how this economic castle looks like, once the “foundation of sand” crumbles.
Or, to phrase it even more picturesque — when the storm breaks and the dragons dance.
Key Takeaways
Interest rates are a crucial factor of the economy
In a free market, they are established by the natural time preference of each individual within a population, in other words, by supply and demand
In today’s economy they are artificially influenced/controlled by governments, mainly through central bank market interventions
Low interest rates stimulate the economy, drive up asset prices and set the foundation for consumer price inflation
A boom, which is induced by artificially low interest rates, must finally lead to a bust
I hope you enjoyed reading this newspaper. I put a lot of work into it and if you think the content is worth your time, please consider to subscribe, so you can receive it on a monthly basis. Its free and without commercials.
Best regards,
Disclaimer: The content of this newsletter is for informational and educational purposes only. It contains my personal views and opinions, which are not to be taken as direct investment advise. All investments have risks and you should do your own due diligence before making any investment decision. If you require individualized advice, to review your unique situation and make a tailored advice for you, then contact a certified financial planner or other dedicated professionals.


