Ataraxia Financial Newsletter - November 2022
Mexico and the Mayas, Crazy Stuff in the Cryptoverse, the CAPE Ratio - and - Is the Zombie Apokalypse Ahead of Us!?
Civilizations rise, and then decline - and then rise again. Markets arise, soar, collapse, and begin rising again. History records the whole thing as a pack of lies and misunderstandings involving hairy people with tails, doing foolish things for absurd reasons. But there are moments of glory, too, when men occasionally stand on two feet.
— Bill Bonner
November 11th, Puerto Vallarta, Mexico.
For the past weeks, I had the chance to reunite with some of my closest friends and travel across Mexico together. We have been friends since 1st grade of elementary school (that’s now more than 25 years ago) and since we can’t see each other so frequently anymore, it was an memorable experience to hang out together and have long conversations on all the aspects of life that are important to us — and all while exploring a country that none of us had ever been to before.
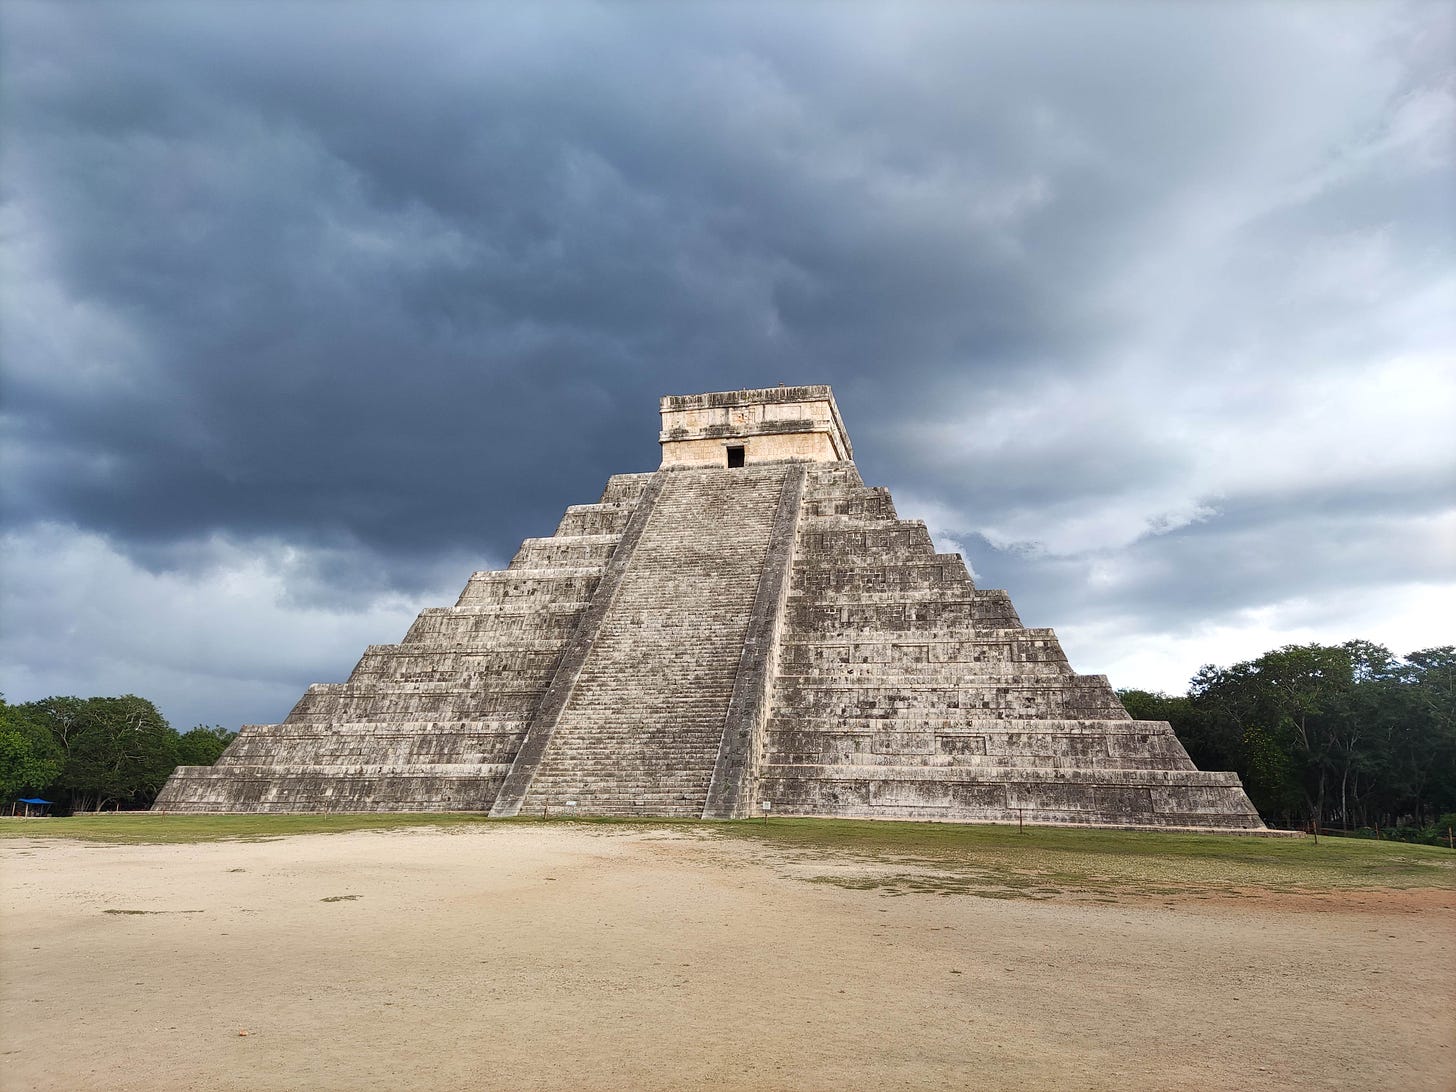
We started off in Cancun, where we rented a car, and from there we embarked on a round-trip around the Yucatán Peninsula. We stayed a few days in the towns of Tulum and Mérida, from which we explored Cenotes (caves of limestone rock, filled with water) and visited several ancient Mayan ruins.
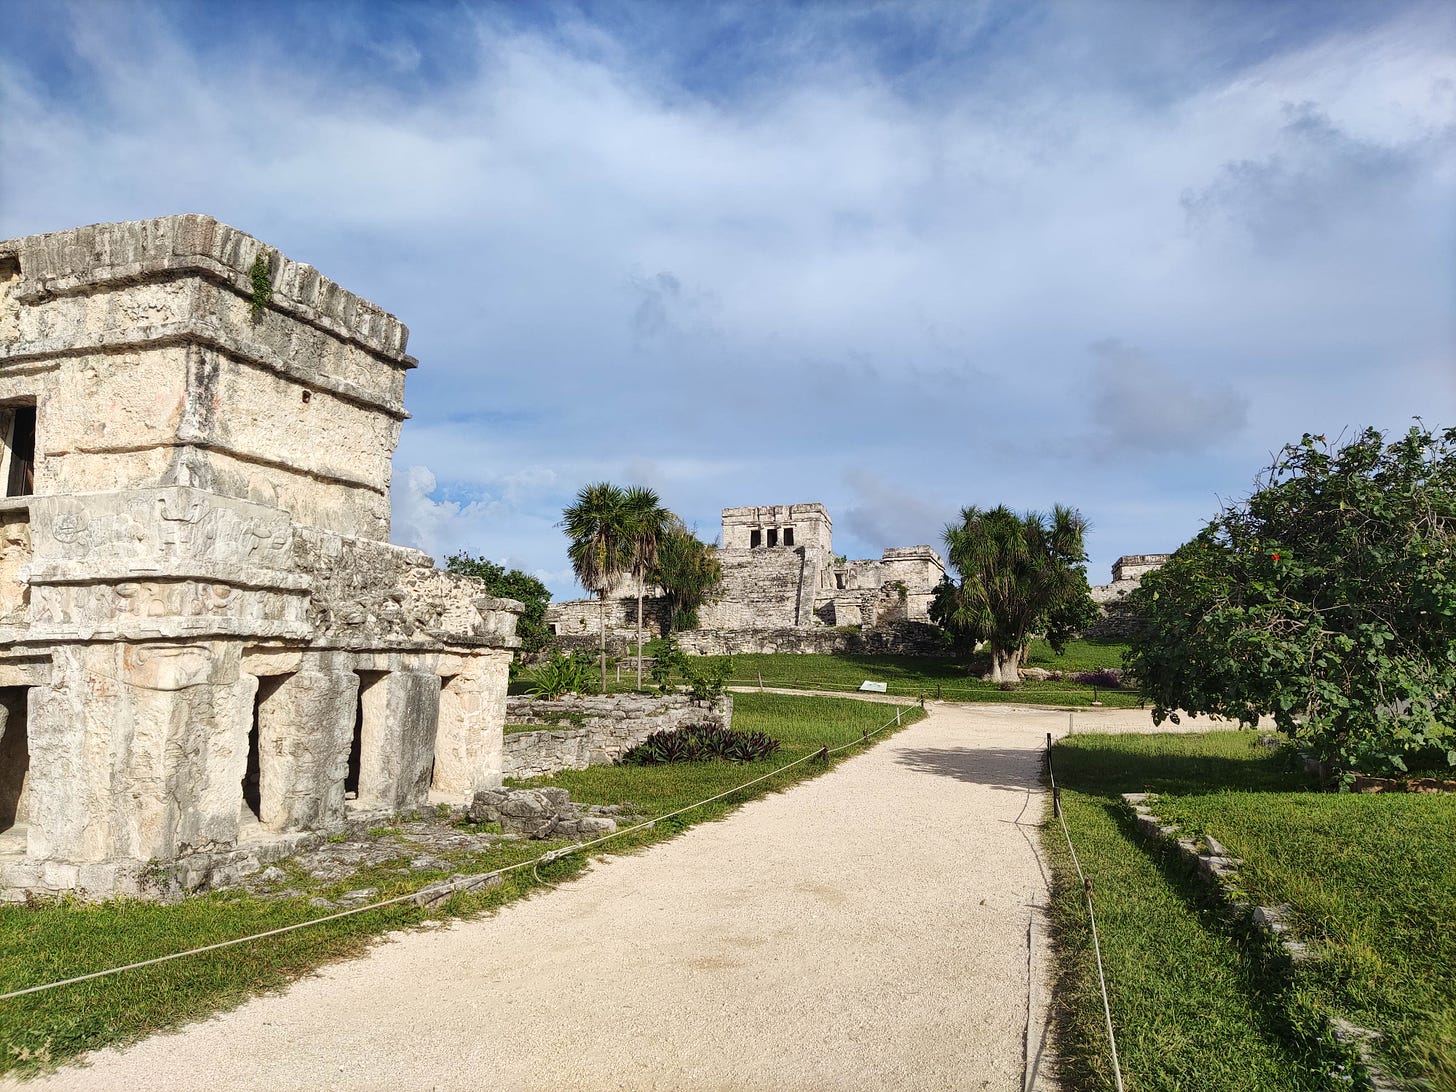
The rise and decline of civilizations throughout history has always been an interesting topic for me. The Mayan civilization offers an interesting case study. It was a well advanced culture, that was able to build impressive buildings, made great progress in agriculture and came up with sophisticated calendar systems, as well as hieroglyphic writing. But surprisingly, it is still unknown and there is no clear evidence, how the decline of this civilization happened. According to History.com:
Scholars have suggested a number of potential reasons for the downfall of Maya civilization in the southern lowlands, including overpopulation, environmental degradation, warfare, shifting trade routes and extended drought. It’s likely that a complex combination of factors was behind the collapse.
In German schools (and I guess most other Western countries), there is a tendency in history classes, to focus on the wrongdoings of the “white race” and its meddling in other countries by conquest and colonization. I guess that if asked about the reason for the Mayas decline, most German students would immediately answer, that it is because of the Spanish colonization — without even having gone through the exact historic events, but just looking at it through the general lens through which history is taught and perceived.
The truth though is, that the Spanish conquistadores only arrived in the early 1500s, at a time in which most of the decline of the Mayan civilization had already happened. Thus, the Mayans offer an example that major civilizations can rise and decline not just by exterior forces, but all by themselves.
I am by no means a well-read historian. I just have some basic interest in history and how different ideas and life philosophies have shaped it.
My thinking about world history was actually deeply influenced by mainly reading about it from an economic perspective. Especially Murray Rothbard’s revisionist take on historical events had a great contribution to the way I think about it.
Focusing on economic incentives in combination with the predominant ethical philosophy of the actors and their incentives at the respective time and place. And then further look at it from an individual perspective, rather than through a collective angle: What did individual people do? And why did they do it? What was it that drove their incentive to do it?
Rothbard comes to the conclusion, that history can basically be boiled down to a constant race between the struggle for power over others on the one hand, and peaceful cooperation on the other:
Just as the two basic and mutually exclusive interrelations between men are peaceful cooperation or coercive exploitation, production or predation, so the history of mankind, particularly its economic history, may be considered as a contest between these two principles. On the one hand, there is creative productivity, peaceful exchange and cooperation; on the other, coercive dictation and predation over those social relations.
— Murray Rothbard
From all that I know and have learned about history, this view offers the best framework to look at historic developments and events, since it always provides reasonable explanations of what might have happened.
From this viewpoint, my theory would be that the Mayan culture rose to predominance when they were more free and cooperative as compared to their neighboring tribes. This is supported by the circumstance that according to the inscriptions we are reading while strolling the ruins, trade played a major role in their daily life.
This allowed them to engage more profoundly in the division of labor, which in turn led to significant progress, revealed by innovations in agriculture, technology and architecture.
As the Mayans rose to become the predominant power in the area, the leadership of the Mayans over time likely extended their power over their population. They confiscated more of the food for themselves, they enlisted more soldiers to conquer new territory and they let them build bigger and bigger pyramids to get worshiped.
Using the predominant religious superstitions, individual actors were able to gain more power over their subjects, who willingly followed their ‘wise’ leaders, who were the intellectual class at the time.
Hence, the parasitic elite grew over time and at some point got too big for the underlying productive working sector — that it was feeding off — to support.
The consequences were:
More centralization of decision making.
Less freedom.
Less progress & innovation.
This, in turn, resulted in a crumbling economy, followed by a declining civilization.
(Side note: This is a phenomena that has repeatedly happened throughout history and I think that the massive debt levels in our society and first signs that even major sovereigns are on the brink of not being able to service their debt, is a sign that the parasitic parts of society — mainly embodied in the state and its institutions — has also grown too big).
One of the aspects that is well known about the Maya society, is how they waged wars and how they dealt with the tribes that they conquered. They believed in a bunch of gods and the defeated enemies served as a welcomed way, to use as a sacrifice to honor them. Wikipedia gives the following description:
During the pre-Columbian era, human sacrifice in Maya culture was the ritual offering of nourishment to the gods. Blood was viewed as a potent source of nourishment for the Maya deities, and the sacrifice of a living creature was a powerful blood offering. By extension, the sacrifice of human life was the ultimate offering of blood to the gods, and the most important Maya rituals culminated in human sacrifice. Generally, only high-status prisoners of war were sacrificed, with lower status captives being used for labor.
Basically, if you fought against the Maya and were captured, you either became a slave and were coerced to build these impressing monuments, or — if you held an important rank — you got the honor of being sacrificed.
Moreover, the sacrifice methods of their rituals were quite vicious:
In a beheading event for instance, “the victim was tortured, being variously beaten, scalped, burnt or disembowelled.”
Arrow sacrifice was another popular method. In such an event, “the sacrificial victim was stripped and painted blue and made to wear a peaked cap, in a similar manner to the preparation for heart sacrifice. The victim was bound to a stake during a ritual dance and blood was drawn from the genitals and smeared onto the image of the presiding deity. A white symbol was painted over the victim's heart, which served as a target for the archers. The dancers then passed in front of the sacrificial victim, shooting arrows in turn at the target until the whole chest was filled with arrows.”
Heart extraction was the major and most cruel method:
“It began with a dispersal of blood extracted either from the mouth, nose, ears, fingers, or penis, typically with a sharp tool made from animal bone, such as a stingray spine. They then positioned the victim on a stone or wooden altar. Next, access to the heart would be achieved with a variety of procedures and techniques. […] Following access, the heart was exposed to retrieval. If accessed through the sternum, the ribs would be pulled apart, or tissue would be cut through if accessed through the diaphragm. The actual removal of the heart would then be continued by cutting any attaching ligaments with a bifacial tool. Finally, offering of the heart would take place with either special positioning or through burning. At this time, blood would also be collected from the victim. The ritual will end with mutilation of the body, usually through dismemberment, or burned”.
I also read that finally the dead body would be thrown down the stairs of the pyramid into the cheering crowd.
In other words, the Mayans were not only this advanced and harmonious culture, like it is often depicted in Western books and movies, but they also had some quite sadistic streaks in their culture.
Back to our trip.
After our Yucatán round-trip, we took a plane to Mexico city, where we stayed for 4 days to explore the capital.
Exiting from the airport, I was right away surprised by how cold the temperature was in comparison to Yucatán, just 2 hours earlier, since it lies at about the same geographical latitude. I learned that it is mainly due to the high altitude of the city, at 2240 meters above the ocean, which also became obvious to me when I went for a run and I needed to run slower than usual to keep within my target heart-rate zone.
Mexico city is a big metropolis and according to Wikipedia, it is the world’s 5th largest city. It is marked by imposing skyscrapers with impressive modern architecture, which stand in a strong contrast to an otherwise not very developed city, which often seems dirty and is surrounded by slum-like districts.
Next, we took a night-bus to Guadalajara. Despite comfortably adjustable reclining seats, perfect air-conditioning and spacious legroom, none of us could sleep well in the bus — which is partially due to a very uneasy and abrupt driving style, which apparently most Mexican bus and taxi drivers seem to have adapted.
I liked Guadalajara better than Mexico city. It felt more relaxed and I also appreciated the remnant architectural spirit of the colonial time. However, it is just a matter of preference, my friends were more inclined towards the vibes of Mexico city.
From there, we went on another 8-hour bus ride to Puerto Vallarta, which I really enjoyed. The ride took us through an amazing landscape. It was just pure nature, marked by fresh green jungles and mountains in the backdrop — totally different from the desert-like landscape filled with occational cacti — which I imagined most of Mexico’s landscape (except Yucatán) would look like. Along the ride, there were almost no signs of civilization, except for some scattered small villages. It was just fascinating.
From the bus station in Puerto Vallarta, we took a taxi to the town of Sayulita, where we spent the remaining days of our journey.
Sayulita is really nicely located between a bay-like beach and several mountains that abate into smaller hills and valleys towards the ocean. This makes a beautiful scenery. The town is packed with (mainly North American) tourists, backpackers — and Yogis.
Looking for a “gym” on google maps returned me a bunch of Yoga- and Pilates places. And indeed, our hostel also offered a daily morning class in yoga, which I took advantage of. I actually wanted to give it a try for a long time already, reason being that I think it might be a really beneficial accompaniment to my regular endurance and strength training, which might lack to some extend when it comes to mobility. However, I had never ultimately pushed myself to go for it, so I finally did it. And I think it is indeed a quite positive exercise add-on. Besides that, it’s definitively a nice way to start into a day!
Our hostel was located on a hill and the common area was equipped with a restaurant, bar and pool, all situated on top of an architectural interesting construction complex of several towers, with a really nice view over the bay area.
Throughout the trip, we could see all the preparations for ‘Día de Muertos’ (the Day of the Dead), which is an important traditional celebration in Mexico, that takes place on 1st and 2nd of November. The day is to remember and honor ancestors. Interestingly, the celebration days themselves, revealed to be less of a mourning event, since the general atmosphere did not really have a solemn tone, but rather felt like a joyful celebration.
I first felt a bit strange, since my expectation was that it would be kind of a mourning event, but then there were skeletons dressed in funny attires and skulls with funny grimaces, in all kinds of shapes and poses everywhere.
And the general mood was joyful.
My takeaway was: A bit strange, a bit funny and culturally quite interesting.
Overall, the trip was an absolute blast and we are looking forward to repeating that in other parts of the world in the future.
Now my friends are back in Germany, while I have the luxury to spend some more time in sunny and warm Puerto Vallarta.
This was a long introduction, so let's turn to the crazy world of finance. The remainder of the newsletter will cover the following topics:
Part l - Market Analysis:
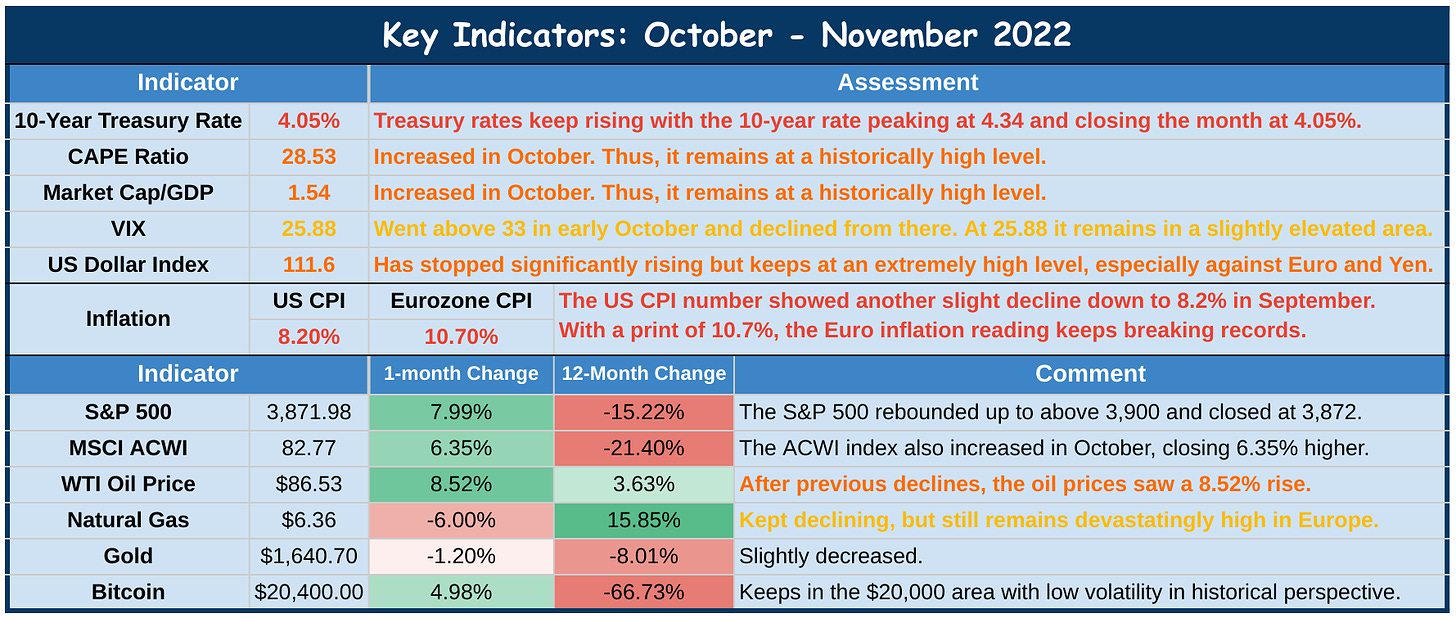
Key Indicator Rundown
FTX Blows up - The Next Chapter of the Crypto-Winter
The Story of Sam Bankman-Fried FTX
The Story of Binance and CZ
What to Think of It and What Is in the Cards For the Future Development of the Industry?
The CAPE Ratio as an Economic Indicator
How Does the CAPE Ratio Technically Work?
The CAPE Ratio as Investment Tool
How to Think About the Current CAPE Ratio?
Part ll - The Zombification of Companies & Sovereigns
Corporate Zombieland
Sovereign Zombieland
Conclusion
Part l - Market Analysis
First, sorry again for the late publication. In the current market environment, there are always huge changes in just a few days, so that the numbers from the end of October, again, seem already outdated.
I still have the goal of publishing the newspaper right at the beginning of the month, but since I am struggling to do that I am contemplating whether it would be better to change the concept of it a bit. Thus, I am considering to be more flexible with it and instead do the analysis and key indicators from each specific publication date to the next (e.g. November 11th, to December 15th, instead of a strict monthly structure. I’m happy to hear any feedback.
Anyway, let’s dive in.
Key Indicator Rundown
Inflation: In September, we saw the US CPI inflation print slightly decline to 8.2%, while the Eurozone CPI saw a new record with 10.7%. At the time of writing the October inflation rate just came out at 7.7%. This is 30 bps lower than the expected 8.0%, which came as a surprise, as the forecast was 8.0% and the market has gotten used to the forecasts consistently underestimating the actual prints over the last 2 years.
The 10-Year Treasury Rate went as high as 4.34% in October, before slightly decreasing, but remaining above the 4% mark for most of the time. Meanwhile, the yield curve remained inverted in different shapes throughout the month.
As expected, the Fed came out with another 75 bps rate hike in early November, increasing the target rate to 3.75-4.00%, sending the short-term Treasuries to new heights.
However, following the CPI announcement, treasury yields saw an immediate and material drop, pushing the 10-Year Treasury Rate below 4%. Nonetheless, the yield curve remains inverted, hinting at further recessionary developments.
The current rates are:
2-Year Treasury Rate → 4.61%
5-Year Treasury Rate → 3.943%
10-Year Treasury Rate → 3.829%
30-Year Treasury Rate → 4.081%
→ Resulting in a wave-like yield curve with a very high wave in the short-term
Further, the lower than expected CPI number also indicates that the Fed policy is successful in its attempt of fighting inflation and therefore might sooner stop its tightening cycle.
The S&P 500 saw a 8% gain in October, closing at $3872.
The MSCI ACWI also had an overall positive month, gaining 6.36%.
However, there were some highly anticipated earning reports of the technology industry, most coming out disappointing. The combined impact of high inflation, rising interest rates have already made the environment for growth stocks difficult. Due to these bad earning reports exacerbating the cloudy outlook, most of the top technology companies tumbled to new lows.
bad reports resulted in layoffs throughout the Tech sector, some notable are:
Twitter: After Elon Musk finalized the takeover, he let go half of the workforce (about 3700 jobs). And he also cut through the high ranking employees. Seeking Alpha reports:
Snapshot: A series of layoffs started as soon as Musk took over the social media company, including CEO Parag Agrawal, finance chief Ned Segal and senior legal staffers Vijaya Gadde and Sean Edgett. In the days that followed, other departures have included Chief Marketing Officer Leslie Berland, Chief Customer Officer Sarah Personette, and Jean-Philippe Maheu, vice president of global client solutions. After the layoffs were sorted, Twitter Chief Accounting Officer Robert Kaiden reportedly left the company, becoming one of the last pre-Musk C-suite executives to depart.
In recent weeks, Musk has started hinting at his staffing priorities, saying he wants to focus on the core product. "Software engineering, server operations & design will rule the roost”
The public is very divided about Elon Musk running Twitter and it will be really interesting to see how this company will develop moving forward (I personally side with him and his purpose to go all-in on fee speech).Meta (Facebook) → 11,000 jobs
Microsoft → 1,000 jobs
Coinbase → 1,100 jobs
Shopify → 1,100 jobs
Netflix → about 450 jobs
Robinhood → 31 of its workforce
Tesla → 10% of its workforce
As part of this gloomy picture: Amazon has broken a (negative) record, by becoming the first public company to lose more than $1 billion in stock valuation, as its share price fell to a combined value of $879 billion (It had peaked at $1.88 trillion back in July 2021).
Explained: The main issue is that technology companies are mainly considered as growth companies and they currently have very high price-to-earning ratios (see the explanation of the CAPE Ratio below). The valuation of these companies is mainly derived by applying a Discounted Cash Flow (DCF) evaluation, in which the expected future cash flows are discounted by a discount rate. The determination of this discount rate is highly determined by the interest rate. Thus, as interest rates keep rising, the valuation of companies with higher future expectations — mainly technology companies — declines more substantially.
As a result of the lower inflation numbers and sinking interest rates, the stock market saw a massive surge right from the get-go, as they opened on Thursday, November 10th, shortly after the CPI print announcement.
The Nasdaq was up more than 5% within the first trading-hour and closed the day up 7.35%.
The S&P 500 which gained 5.54%, closed at $3956.
The CAPE Ratio and Buffett Indicator have both increased in October. I will dive into the CAPE Ratio below.
The Volatility Index (VIX), which is a gauge for the general fear and uncertainty in the markets, went up to 33 in October, but then kept decreasing and remains hovering around 25%, which is slightly elevated in a historical context, but not really concerning.
The Dollar Index has stopped its staggering rise and even dipped a bit in early November. Nonetheless, it is still massively up as compared to just a few month ago, putting pressure on the many economic entities around globe, who generate income denominated in their respective local currencies, but have to service USD-denominated liabilities.
Oil prices have seen some resurgence recently. The WTI crude oil price was up 8.5% in October and is currently trading around $85 dollars.
In contrast to oil, natural gas prices have come down a bit (around 6%), but the diesel prices still remain uncomfortably high, which adds to the price pressure of construction, transportation and shipping costs. Oil price analyst Tom Kloza summarized that "the economic impact is insidious because everything moves across the country powered by diesel. It's an inflation accelerant, and the consumer ultimately has to pay for it." One of the main reasons for the diesel issue is that there hasn’t been any investment in refineries in recent years and during the COVID lockdowns many have gone offline and have not been turned on again. Moreover, the ban on potential Russian imports also exaggerates the situation.
The gold price declined slightly throughout October. The volatility is quite low in comparison to most major assets. However, in early November it saw a substantial price increase back above the $1,700 mark and following the CPI announcement it jumped up again and is trading at 1,750 at time of writing.
Bitcoin was up about 5% in October, with astonishingly low volatility — in retrospect it might have been ‘the calm before the storm’:
Over the last few days, we are witnessing another big collapse making its way through the industry — and Bitcoin is now by many measures witnessing its most tremendous bear market in its 14-year history.The interconnectedness of counterparty risks are playing out at full scale right now and many entities might be in danger of collapsing.
However, it is important to note, that this has nothing to do with the core fundamentals and value proposition behind Bitcoin.
For a more in-depth analysis about the current developments around the FTX collapse, read on below.
FTX Blows up - The Next Chapter of the Crypto-Winter
The cryptoverse doesn’t stay boring for a long time, that’s for sure!
Back in July, I wrote a long piece about the Luna & Terra Implosion and at that point it was not sure, whether there would be further dominos to fall, or if all the naked swimmers had been exposed.
Over the last months, it seemed like the contagion was over, with the crypto markets surprisingly stable and Bitcoin prices even holding up pretty well in comparison to all the other crazy stuff that has been going on in the TradFi markets. Bitcoin’s volatility was even falling below the Nasdaq and S&P 500's. But over the last few days, a new story unfolded rapidly, sending the cryptomarkets tumbling down with Bitcoin making new lows in this cycle (at around $16,000 at the time of writing).
One thing is certain, the stories in this industry are always colorful and fascinating!
Let’s first take a quick glance at the current crypto casino industry.
There are (or rather were) three major crypto exchanges that have emerged over the last years and months:
Coinbase: Founded in 2012, it is one of the oldest and most mature crypto exchanges. For a long time it was also by far the largest exchange. It went public April 2021 and became the first crypto exchange that can also be traded on a traditional stock exchange.
Binance: Binance was founded in 2017 in China and was often in the press as it changed its headquarters several times due to changing regulatory environments. It’s own token (self-printed money) currently holds rank 4 on Coinmarketcap.com and it also issues the 3rd largest stablecoin (BUSD) ranked 6th overall. Moreover, it recently overtook Coinbase as the largest crypto exchange.
FTX: Founded in May 2019, it quickly emerged as the upcoming exchange. Particularly in the months succeeding the Luna implosion, it gained a lot and was rapidly making up ground in comparison to its competitors, even becoming the second largest exchange by some measures.
The Story of Sam Bankman-Fried FTX
Sam Bankman-Fried has been the rising and booming character over the last months, appearing on countless popular podcasts and TV shows.
After the Luna & Terra Implosion, he stepped up to (seemingly) generously bailing out troubled crypto firms such as BlockFi and Voyager Digital.
Therefore, he has often been described as the ‘Crypto Savior’.
Some also referred to him as ‘Crypto King’.
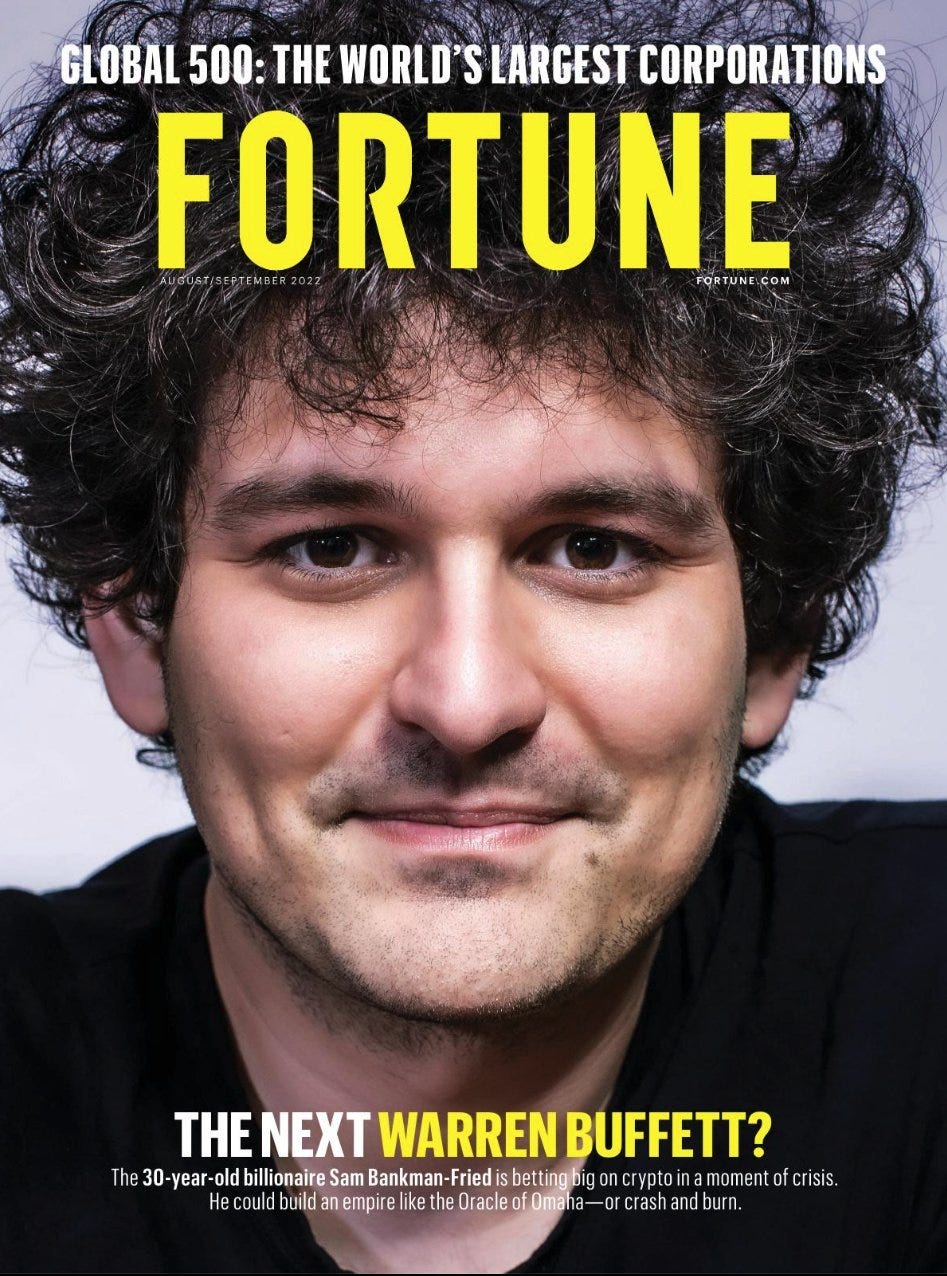
Even Fortune Magazine had Bankman-Fried’s picture on its August/September cover, with the headline: “The Next Warren Buffett?”
With Bankman-Fried acquiring substantial stakes in Robinhood, there were some rumors, that FTX might acquire the trading platform in the future. While he denied this, it was repeatedly stated, that FTX had plans to also provide access to traditional stocks. In addition, Bankman-Fried promoted — and was passionately engaged in — tight cooperation with regulatory authorities. Along these lines, the FTX exchange was marketed as the place that would put TradFi and DeFi together in one spot, to bridge the two worlds so to speak.
Some biographical facts about Sam Bankman-Fried:
He was born in a rich family in 1992.
His parents (Mr. Bankman and Ms. Fried) were both professors at Stanford Law School.
He grew up in the Bay area throughout the Dot-com bubble and also throughout the whole time in which housing prices in this region were skyrocketing.
He graduated from MIT in 2014 with a degree in physics and a minor in mathematics.
apparently, he was quite talented in mathematics.
In 2013, he went on to Wall Street to work for Jane Street Capital trading ETFs.
At the age of 25, he founded the cryptocurrency trading firm Alameda Research in October 2017.
He made huge gains in Bitcoin arbitrage trades.
in May 2019, he founded the FTX crypto exchange.
Before turning 30, he was worth over $24 billion.
He had strong political relations and made huge donations to several political campaigns.
He was the second largest single contributor to Joe Biden in the 2020 election.
In other words, he was exactly the guy who you better stay far away from.
However, the key issue here was, that while being obviously smart and a genius in some areas, in my opinion he didn’t understand the fundamental value proposition behind blockchain technology.
I had listened to him in a few podcasts before and — beside the fact that I disliked his character and regulatory views right away — it was always obvious to me, that he didn’t really have an idea of what makes Bitcoin such a valuable asset. Instead, he talked about all the opportunities that DeFi offers and all the promising projects that are being developed and investors could take advantage of — so he built a crypto casino!
Moreover, being very politically engaged, he was always the one pushing for more government oversight and a more strict regulatory framework for the crypto industry. He was the poster-child for all politicians and people who envision the crypto world to become more institutionalized (which becomes quite interesting and laughable in light of all the news which are being revealed, read on).
On top of it, FTX was printing its own money by creating its own FTT token.
Note: Here is a general base rule that I encourage every ‘crypto investor’ to consider before making any investment: Does the project or platform have an own token that they are promoting? If yes, it might likely be a scam. Or, even if it is not a scam, it will most likely not be successful in the long-run.
Or, an even better base rule: Just allocate some portion of your portfolio in Bitcoin, which is the real revolutionary asset. Put it in self-custody and stay away from all of the crypto circus around it.
Back to the story.
Cory Klippsten, the CEO of investment platform Swan Bitcoin, had been warning that saving other entities, such as BlockFi and Voyager Digital, was not an altruistic move by FTX, but that they are doing it essentially to safe their own exposure to these entities.
But FTX own liabilities were not the only problem.
As mentioned above, Bankman-Fried not only runs the FTX, but also the cryptocurrency trading firm Alameda Research. These two companies are legally two different entities, but basically were working together quite closely.
Real problems started to arise, when Alameda’s balance sheet was leaked on a Coindesk piece on November 2nd. It revealed that a huge portion of their $14.6 billion assets consisted of different classifications of FTT tokens:
$3.66 billion → Unlocked FTT
$2.16 billion → FTT Collateral
$292 million → Locked FTT
Furthermore, another $3.37 billion of “crypto held” assets and huge Solana holdings also revealed huge exposure to other cryptocurrencies that would probably have low liquidity in case of huge selling pressure.
This stood against the liabilities of Alemada Resarch, which amounted to about $8 trillion.
The basic problem here is, that having huge liabilities on the right side of the balance sheet, requires to have sufficient stable assets on the left side.
However, if all you have are blown-up, illiquid (and most of them self-printed) assets with high volatility, then you can run into problems, as the air comes out and the value in these assets rapidly evaporates.
Traders (rightly) started to doubt whether FTX would be able to honor all of their liabilities in case of a liquidity crunch. Thus, they started to take short-positions in the assets held by FTX and Alameda accordingly.
At that point, Binance — another huge holder of FTT tokens — announced to be selling its position.
…which brings us to Binance and CZ
The Story of Binance and CZ
Compared to Bankman-Friend, Binance Chief Executive Changpeng Zhao (commonly known as "CZ"), is a crypto veteran.
He was in the team that developed Blockchain.info (now Blockchain.com), back in 2013, which became a major blockchain data provider and the largest non-custodial wallet.
In 2017, he founded Binance, which has become the largest crypto exchange in terms of trading volume and Bitcoins held in custody.

Upon the leakage of Alameda’s balance sheet, Binance came out with the following statement:
“As part of Binance’s exit from FTX equity last year, Binance received roughly $2.1 billion USD equivalent in cash (BUSD and FTT). Due to recent revelations that have came to light, we have decided to liquidate any remaining FTT on our books. We will try to do so in a way that minimizes market impact. Due to market conditions and limited liquidity, we expect this will take a few months to complete.”
It was quite obvious at this point, that CZ was smelling blood.
And who would be surprised — FTX is (or rather was) their largest competitor.
If Binance would be a friendly economic actor, who just sees risks in their own holdings, they would have tried to secretly sell their assets over the counter.
In contrast, they choose to make it public, so that everyone would see their intention of selling a huge portion (up to $2.1 billion) of FTT.
In other words, they were seeing a wounded animal running and made a pronounced attempt to dump the price in order to give it the final blow.
In order to curb the looming disaster, Caroline Ellison, Alameda’s CEO was quick to reply:
CZ of course didn’t take the deal.
He was not interested in an OTC-deal, which would have had the least possible impact on Alameda and FTX. His goal was exactly the opposite — to have a massive negative impact!
And he succeeded:
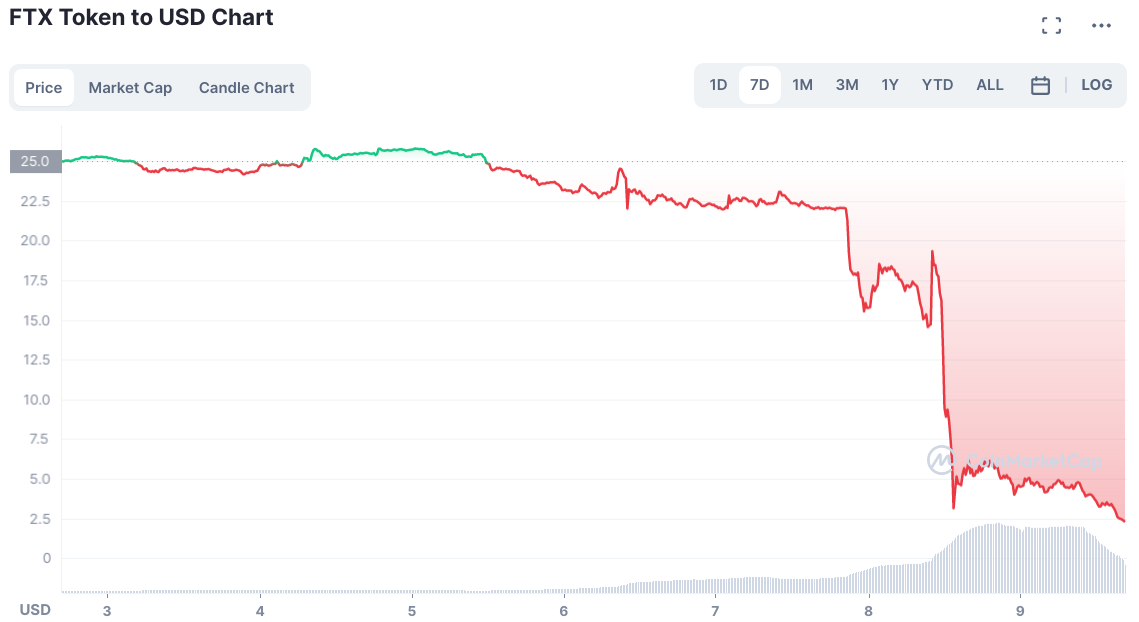
At this point (As Dylan LeClair had already pointed out in reply to the above tweet), FTX and Alameda were the only buyers and increasingly also the only holders of the FTT tokens.
The price rapidly fell below the offered $22 and with all the building selling pressure from other holders, the FTT price totally collapsed within a few hours.
The next chart shows FTX crypto balances during the sell-off. Their main asset was their self-created token, which nobody wanted to possess anymore:
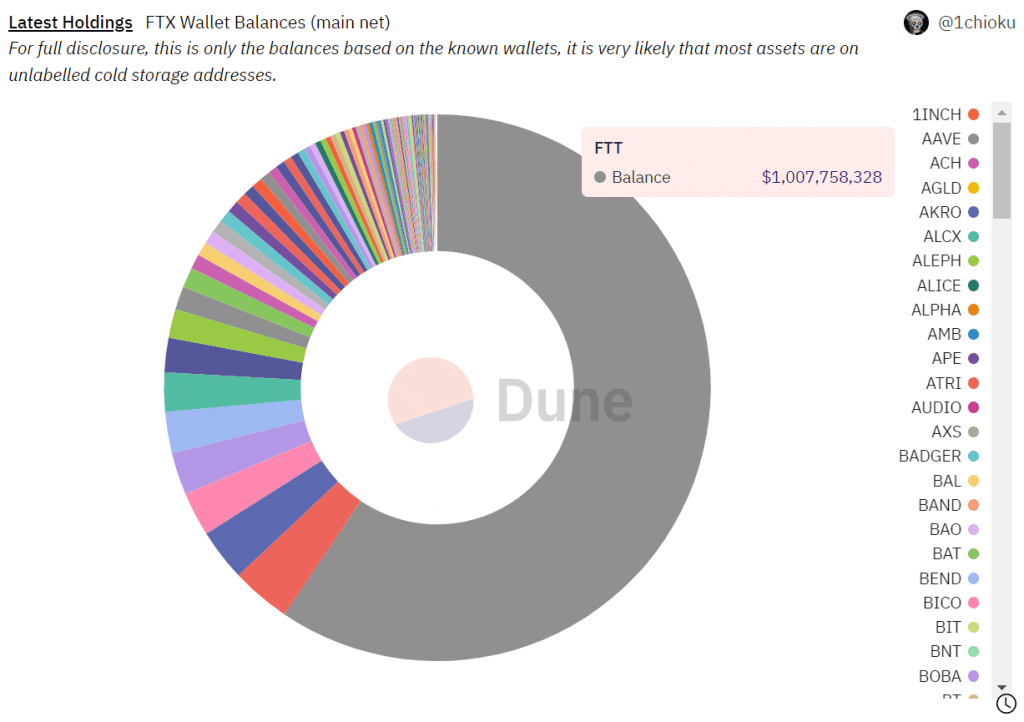
At that time, it was reported, that the crypto exchange was facing a shortfall of up to $8 billion and needed $4 billion to avoid bankruptcy. Apparently, Bankman-Fried was desperately trying to get a liquidity injection from multiple potential investors, but with no success.
What happened next, was a capitulation of FTX and a Letter of Intent by CZ to buy the FTX exchange.
At first, it seemed like the whole succession of events turned out to be an incredible 3D chess mastermind move by CZ, teaching Sam Bankman-Fried a painful lesson in ‘The Art-of-War’.

It appeared as if Binance would successfully end up buying its major competitor for just a few pennies on the dollar.
However, at this point of time, it was just a non-binding agreement and merely a day after CZ had announced, that he would buy FTX, it became clear that he had already backed out of the deal and that the deal was not going to happen:
Apparently, during the due diligence process of the exchange, it became obvious that it was not only an issue of liquidity problems, but that the exchange was engaged in outright customer fraud.
In addition, the conflicts of interest between the two deeply intertwined entities of Alameda Research and FTX also raise many questions about violations against existing business regulations.
This is unfortunately something that we repeatedly see. Especially those people that are close to politics and representing themselves as the ones who are in favor of more regulations and more customer protection, turn out to be ones that even don’t adhere to the basic rules, which are already in existence — in this case, FTX was committing right out customer fraud!
As many observers had already assumed at this point, a report in the WSJ confirmed that the huge funds ($10 billion) that where loaned from FTX to Alameda in previous months, was at least to a significant extend taken right out of customers deposits.
Here are some of the FTX.com terms-of-service:
(A) Title to your Digital Assets shall at all times remain with you and shall not transfer to FTX Trading.
(B) None of the Digital Assets in your Account are the property of, or shall or may be loaned to, FTX Trading; FTX Trading does not represent or treat Digital Assets in User’s Accounts as belonging to FTX Trading.
(C) You control the Digital Assets held in your Account. At any time … you may withdraw your Digital Assets by sending them to a different blockchain address controlled by you or a third party.
It is no question that taking money out of the customers deposit is not just customer fraud, but also a clear violation of its own contract with customers.
He has good political connections in the democratic party, so it might be that he can avoid going to jail — but he definitely belongs there.
It is a sad story.
One final silver lining might be, that CZ stated, that he would implement a Proof-of-Reserve procedure in the Binance exchange. A few entities are already engaged in it, which allows to make use of the potential transparency of blockchains, one of its great features. Allowing for better options for customers to do their due diligence should lead to a more trustworthy operation of the business.
What to Think of It and What Is in the Cards For the Future Development of the Industry?
The whole story is still in the progress of unfolding and there are still many open questions remaining:
The biggest question is, how huge the contagion effects are going to be:
Alameda was a huge player, as a key investment vehicle and market maker in the crypto industry. It is likely that there are many other entities entangled.
Since it is currently a huge bloodbath, there might be margin calls for investors and entities having exposure to loans which are collateralized by cryptocurrencies — especially those that were held by FTX and Alameda.
For instance, Solana was a main asset of Alameda and saw a tremendous decline.
But also BTC and ETH, which are the dominant assets used for collateralization, have declined substantially.
Lending platforms might see some more bankruptcies:
Blockfi, which was ‘saved’ by FTX a few months ago, has already stopped withdrawals.
Voyager, which was also previously saved by FTX, also seems to be in deep trouble.
Genesis has huge exposure to FTX.
ABRA has reported to have some exposure to FTX, but claims that it is small. So far, it remains in full operation.
Ledn has admitted to having had some exposure to FTX and Alameda, but claims that it is limited and will keep in full operation.
Other entities with high exposure:
The cross-chain protocol Stargate,
Tom Brady seed investments
Yuga Labs
Will there be any other ‘saviors’ stepping in and buy out some of the companies that are on the brink of bankruptcy?
Another question was, what really happened between the 3 main entities of the story: Glassnode revealed, that there have been significant flows of funds between not only FTX and Alameda, but also Binance had a lot of interaction with Alameda throughout the previous months.
Do they have more exposure than they let on?
It will for sure stay interesting how this story is going to continue unfolding.
My personal hope is, that it is really another wake-up call for implementing Proof-of-Reserve structures in crypto exchanges and entities.
Key Takeaways:
All major players in the industry dearly need to implement Proof-of-Reserve as an operational business standard going forward.
Stay away from institutions that don’t understand that Bitcoin is the real manifestation of the blockchain technology innovation, and instead keep focusing on promoting altcoins.
Especially stay away from any entities that issue their own token (print their own money)!
And again and again: Not your keys, not your coins!!!
The CAPE Ratio as an Economic Indicator
The CAPE Ratio, also referred to as the Shiller PE Ratio, or cyclically-adjusted price-to-earnings ratio, is a useful tool, to get a broad view of the stock market position.
Essentially, it is a way to gauge whether the equity market is overvalued, or undervalued.
The CAPE Ratio indicator was developed and popularized by Yale economist Robert Shiller. He is famous for his work in behavioral finance and empirical analysis of asset prices.
Some of his work is amazing to read, but there are also some topics, where I disagree strongly with his analysis and think that he doesn’t really get the whole picture.
Schiller also runs a website, on which he has a lot of valuable data for doing economic research, in case someone is interested.
How Does the CAPE Ratio Technically Work?
The price-to-earnings (P/E) ratio is a commonly used ratio. It measures the current stock price (P) in comparison to its earnings per share (E). It is a very common tool used by investors to evaluate a company.
In essence, this ratio tells investors how many years, it would take the company to earn enough money at the current rate, to make up for the investment price.
Here is a quick example:
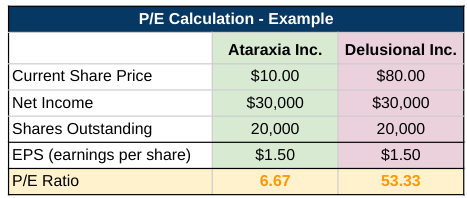
In this example, there are two companies, Ataraxia Inc. and Delusional Inc.
Both companies are profitable. They have issued the same amount of shares (20,000) and both companies are able to generate the same profit ($30,000).
Thus, they also come to the same EPS ratio ($1.50) which is calculated by dividing the net income by the number of outstanding shares.
The net income is the profit of a company and the money that can either be paid out to its shareholders over time in the form of dividends, or alternatively be reinvested to further grow the business.
The main difference in our example is that there is a huge difference in the stock price. Delusional Inc.’s market value is much higher than that of Ataraxia Inc.
Therefore, there is also a huge difference in the P/E ratio. While Ataraxia is trading at a P/E of 6.67, Delusional Inc. is trading at a P/E of 53.33.
In other words, assuming the current earnings remain unchanged and both companies pay out all of them in dividends, an investor of Ataraxia Inc. would make back all of his initially invested money after 6.67 years. (Or, to be exact, even a bit more than 100% after 7 years, assuming the dividends are paid every 6 months).
A 100+% return after 7 years, with $10.50 (14*$0.75) in dividends, while still owning the share.
While getting paid the same dividends, our Delusional Inc. investor on the other hand, would need to wait 53.5 years until he gets the amount of his originally invested money back in dividends.
Therefore, the return on investment for him is much lower.
Generally speaking, the goal of an investor is to buy a share for a low price, to get plenty of earnings for the invested money.
Of course, an economy is a constantly changing and developing organism and therefore in reality things are more complicated and nuanced. There might be very good reasons for Delusional Inc. having such a high P/E ratio.
For instance, they are just about to break-through with an amazing new innovation, or they just started with a phenomenal management team, that is expected to build an awesome business in the coming years.
A totally different — but also viable — explanation could be that they have donated lots of money to the political party that just won the elections and since they also have good connections with the industry regulators, thanks to persistent lobbying over the years, it is expected that they can turn that into their favor and at the same time make life harder for Ataraxia Inc., which decided to stay away from the political circus.
Or… it might of course also just be due to a bunch of delusional investors.
In any event, in the above example, we just looked at the current P/E ratio and based the analysis on it.
The problem is, that due to various factors, the earnings of companies might fluctuate a lot over time and make it difficult to evaluate the accuracy of the current P/E ratio. Furthermore, in events like a recession, where both stock price and earnings fall rapidly in an erratic manner, the P/E ratio might give wrong signals.
Thus, in a constantly changing economy, it might be advantageous to take a step back and watch the performance of companies over time.
This is where the CAPE Ratio comes in and extends this very useful P/E valuation metric, to also include changes over time in its assessment.
What the CAPE Ratio does, is taking the average of the inflation-adjusted earnings from the previous 10 years, instead of just looking at the most recent earnings.
Moreover, this practice can be extended to not only look at individual companies, but taking the aggregate price of shares of a group of companies and dividing them by the aggregate and inflation-adjusted average earnings over the previous 10 years.
Through this methodology, the P/E ratios of indices (most prominently the S&P 500 index) can be analyzed over time. This allows, to get a more advanced evaluation tool, which can be used to assess the overall stock market, trends and also serve as a general indicator.
The CAPE Ratio as Investment Tool
By indicating how stocks are evaluated in comparison to what they are earning, an investor can come to three basic conclusions:
Stocks are undervalued → it might be the right time to invest.
Stocks are overvalued → it might be a good moment to sell.
The stocks are fairly valued → It might be good to hold, but also to be cautious.
Note: The CAPE Ratio is most commonly applied to the S&P 500, but theoretically it can also be applied to any other stock index.
From an investment perspective, it can be a helpful tool when it comes to portfolio allocation. For instance, it can help to decide:
What portion of the portfolio should be invested in the equity market (the higher the CAPE Ratio, the lower the allocation).
By comparing CAPE Ratios of different stock indices, or even countries, an investor might reallocate his investments to other equity markets, based on the ratio.
Zooming out, the CAPE Ratio of the S&P 500 historically looks like this:
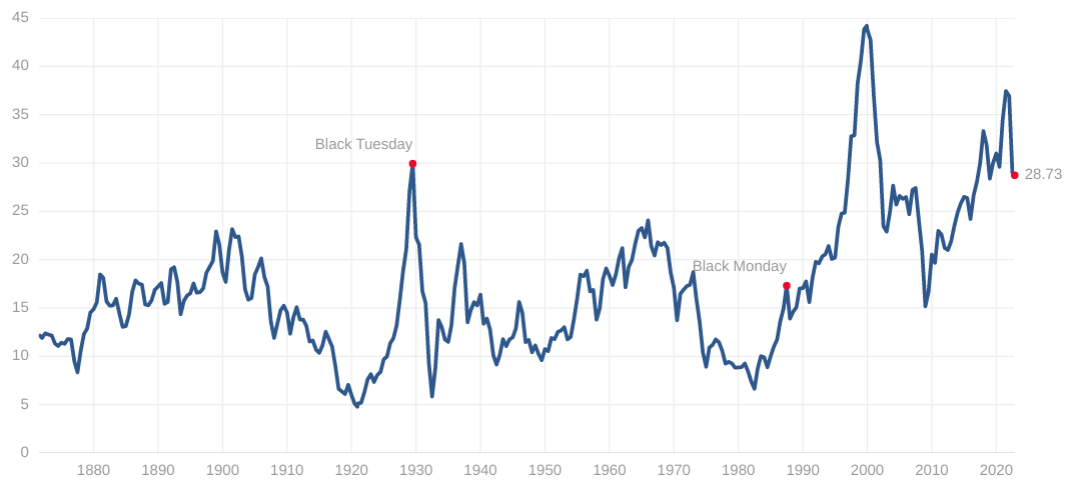
It can be seen that the CAPE Ratio had some really significant swings. Especially, the chart really shows the stock market exuberances that happened in the ‘Roaring Twenties’ and throughout the Dotcom bubble in the late 90s.
Shiller and other researchers have shown in various studies, how the CAPE Ratio is correlated to stock returns over the following years.
The basic findings across the board — unsurprisingly — suggest that there is quite a strong correlation. It is quite intuitive that whenever the CAPE ratio is low, the investments are likely to be profitable over the preceding years. On the other hand, it also makes sense that the reverse should hold true, when the CAPE Ratio is very high.
Here is a chart that shows how investments at different CAPE Ratios have performed over the following 10-15 years. The table on the right side also looks at the performance across several countries:
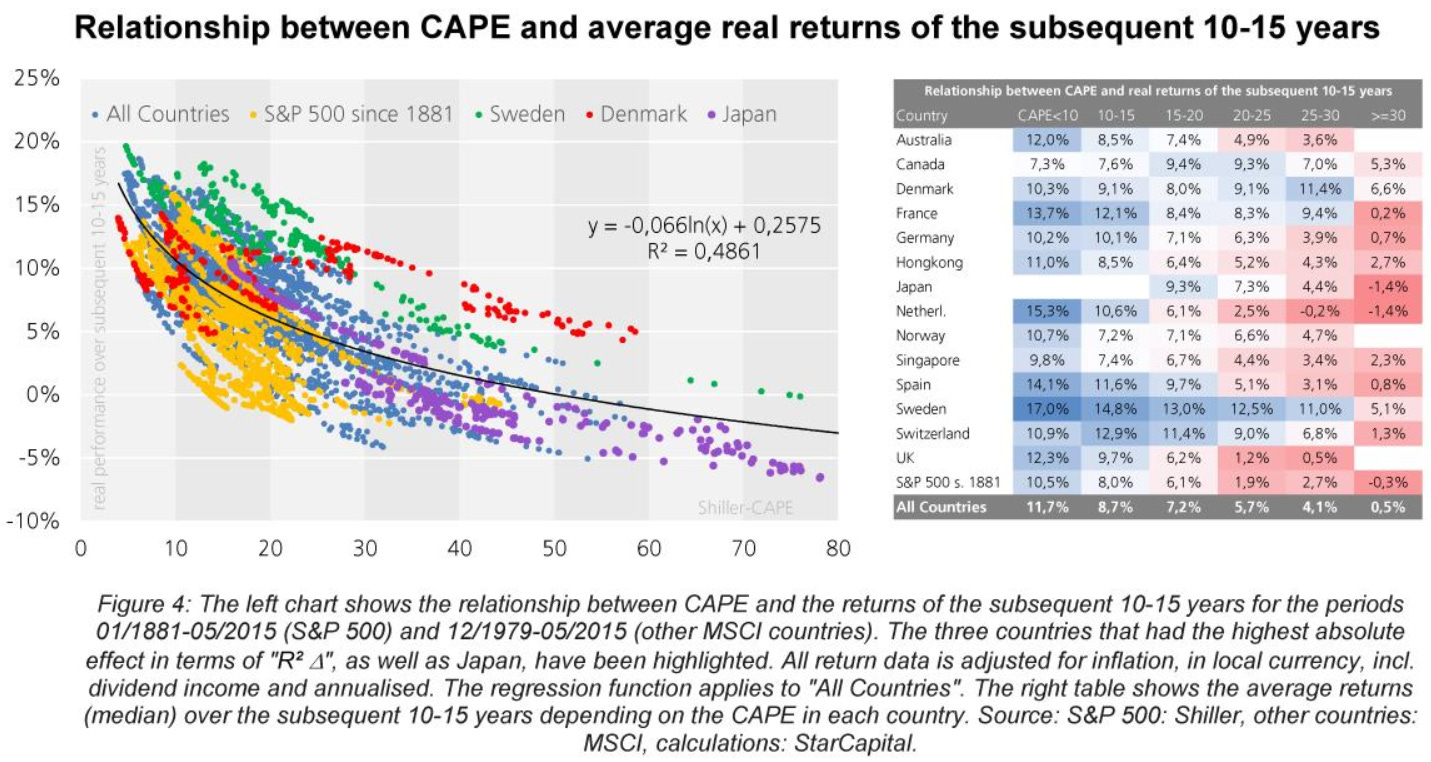
It can be seen, that investing in the main stock index at times in which the CAPE Ratio was below 10, guarantied a return of at least 7.3% over the following 10-15 years (expect for Japan, because the CAPE Ratio of the Nikkei never fell below 15).
It also shows, that investing at a time in which the CAPE Ratio was above 30, was followed by weak, or often even negative returns over the preceding 10-15 years.
Thus, we can conclude, that at least historically, the CAPE Ratio has offered a valuable gauge for investors.
Here are some basic statistical data points:
Mean: 16.99
Median: 15.89
Min: 4.78 (Dec 1920)
Max: 44.19 (Dec 1999)
The main data point to look at, is the mean of 16.99 → we are currently at 28.73.
How to Think About the Current CAPE Ratio?
The above posted “CAPE Ratio” chart shows that we are currently at a really high level. Even though the ratio has somewhat declined since the peak at the start of the year, standing now at 28.73, it is still in a territory that was only exceeded at the start of the Great Depression in 1929 and at the height of the Dotcom bubble in 1999.
Based on historic observations, we should expect very low or negative stock market returns over the coming decade(s).
How much further could stock markets decline, based on historic observations?
Taking the average of 16.99 as a benchmark, this would bring the S&P 500 down to 2,336, which would mean a further decline of 41% from current levels (at 3390). The S&P currently has a market capitalization of about $30 trillion. Hence, if we would see such a decline, this would mean that $12.3 trillion would evaporate. Not even taking into consideration, what ripple effect that would have on all the other global markets.
Moreover, if we assume a scenario, in which it falls below its average, the potential meltdown could be even more severe.
The world would suddenly need to realize, that it is a lot poorer than it currently believes to be.
That’s also why readers of my newsletter by now should be quite familiar with the red or orange colored warnings about the high level of the CAPE Ratio in my Key Indicators table.
There are of course counter arguments to this assessment and in recent years, many analysts have debated, whether this metric is still a viable way, to assess market valuation. Some arguments against it are:
The CAPE Ratio is outdated because the business environment has changed and a more innovation driven economy allows for more growth potentials and therefore higher P/E ratios.
Updated accounting rules have also changed how corporate earnings are calculated and therefore also alter the CAPE Ratio.
The CAPE Ratio has been quite high for a long time (the S&P CAPE Ratio hasn’t been below 15 since 1990) and that suggests that the general environment has changed and we shouldn’t pay too much attention to outdated valuations.
I think that these criticisms have a point, but I think they are wrong. I still think that in essence, the CAPE Ratio is a very important metric to look at.
My general economic thesis is, that we have totally lost the view of real pricing in our economy. The most important price in the economy is controlled and managed by the Fed Committee, consisting of 12 voodoo academics, it is not discovered naturally on the market.
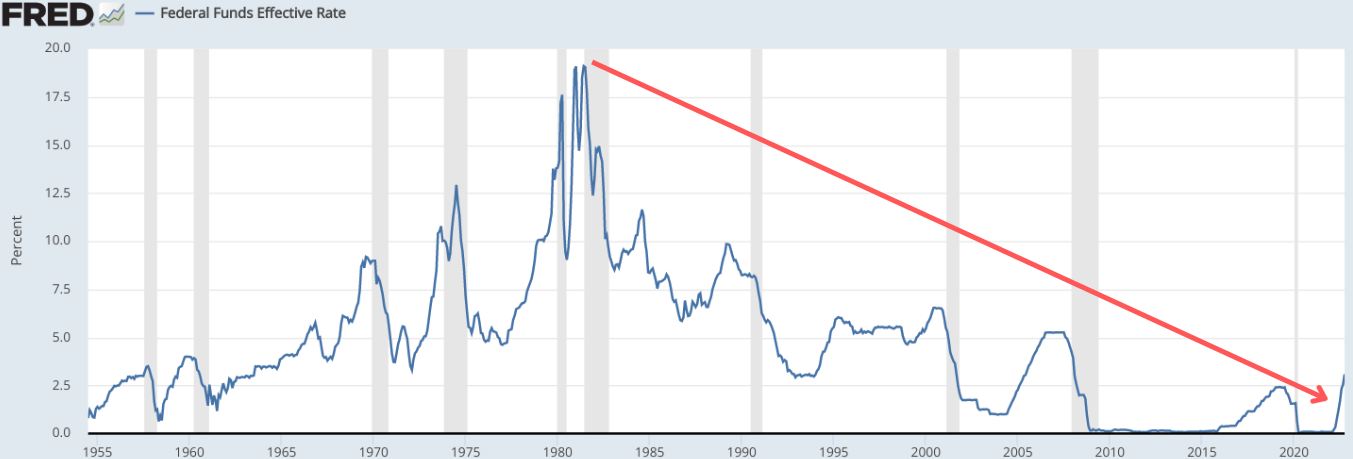
It might not be a pure coincidence, that the constant decrease in the core interest rate since 1981, has happened throughout the same period in which the CAPE Ratio has been generally trending higher.
In fact, I think a huge factor for the constantly high CAPE Ratio can be directly linked to the big debt cycle and low interest rates. We have had easily available credit and this has led to massive money expansion over the last decades.
In a world in which central banks would suddenly and miraculously cease to exist, we would see rates rising even quicker than now, which would lead to a big collapse of the whole financial system. Consequently, the CAPE ratio would also come down to historically normal levels. In a turbulent financial collapse, it would probably fall even well below its historic average.
We are obviously in a very different world though: A world in which the whole investment world is anticipating, speculating and trembling, about what is going to be the next move of the Fed. In this world, everything is possible. We might see even a higher CAPE ratio in the future.
To conclude, I think the CAPE Ratio is a valuable metric and I think it currently shows that we are in an equity asset bubble. Thus, in a world with a natural interest rate (e.g. in a world in which Bitcoin has reached the status of being the main global reserve currency), stock prices would fall substantially.
As long as the Fed keeps rising rates and tightening the money supply, we are likely going to see stock prices falling and the ratio declining.
However, I believe that the Fed will — politically and/or economically — be pressured to pivot its current path at some point and revert back to massive money printing. When this happens, we could see the CAPE Ratio trending upwards again and potentially even reach new heights.
Part ll - The Zombification of Companies & Sovereigns

Our whole financial system is based on fiat money.
Money is crucial, since it is 50% of every transaction and the price of money is the interest rate. I wrote about the importance of the interest rate in the educational part of the February Issue. If the money supply is centrally managed and is continuously expanded — which it almost always is — this pushes the interest rates below their natural level, making the access of money cheaper than it normally would be, which in turn leads to many consequences.
One of them is, that it turns the economy into a zombieland.
In financial jargon, a zombie refers to an entity that might earn just enough to service its current debt, but only by going further into debt. They don’t generate enough money to actually reduce their debt level. Hence, in order to keep operating, they have to continuously increase their overall debt burden in order to cover expenses and keep operating.
In other words, they don’t have a viable business model that is generates profits and therefore offers something that makes the world better.
Instead, like a zombie, they are graving for new flesh (easy money) that they can suck out of the system to keep going. They are detracting from the available supply and therefore they are not real living entities and can only survive in a world with access to cheap credit.
In short, they are neither really dead, nor really alive.
Corporate Zombieland
Zombie companies have been increasing for several decades (along with cheap credit and money extension), but during the Covid pandemic, with its massive stimulus packages and credit expansions by governments around the planet, they saw an enormous surge.
It is not easy to exactly determine which company is a zombie and which actually has a viable business perspective in the future. That’s why it is hard to tell, how bad the infection rate actually is.
Here is a chart from Axios Visuals, using multiple sources in an attempt to measure the percentage of zombified U.S. corporations:

You can see that the zombies are indeed in a massive surge! 😱
Sovereign Zombieland
Zombies don’t restrict themselves to corporations, also some sovereign nation states are entering zombieland — and they are multiplying rapidly.
With rising interest rates, it becomes more and more obvious to many observers, that the debt levels are not sustainable. Most people familiar with the Austrian school of economics have been pointing this out for a long time.
If a government is not able to manage a positive budget in times of economic growth and near-zero interest rates, but instead has to take on more and more debt, it is likely already in zombieland.
When the tide goes out and…
Interest rates rise.
The issuance of new debt gets more expensive.
Rolling over the already existing (massive) debt burden becomes more expensive.
The economy is heading for a recession.
The government collects less taxes.
There is more pressure to spend money to support people who lose their jobs.
More pressure to inject stimulus packages for the economy and the demand for saving “system-relevant”, or “too big to fail” businesses.
Governments are in an effort to:
Increase their war machinery in order to fight self-created enemies.
Engage in de-globalization, protectionism, bans and sanctions.
Divert funding away from cheap and reliable energy resources into expensive and unreliable energy-adventures.
…then we are on the way to witnessing the absolute zombification of nation states.
Conclusion
Central banks continuously issuing cheap money has not only kept many unproductive companies alive, but has also boosted the creation of new zombie entities.
As the debt levels of sovereigns keep dramatically rising, while interest rates are moving up, we are also witnessing further zombification of the nation states themselves.
I hope you learned something.
Watch out and stay away from the zombies!
I hope you enjoyed reading this newspaper. Likes, comments and shares are highly appreciated. I put a lot of work into it and if you think the content is worth your time, please consider to subscribe, so you can receive it on a monthly basis. Its free and without commercials.
Best regards,
Disclaimer: The content of this newsletter is for informational and educational purposes only. It contains my personal views and opinions, which are not to be taken as direct investment advise. All investments have risks and you should do your own due diligence before making any investment decision. If you require individualized advice, to review your unique situation and make a tailored advice for you, then contact a certified financial planner or other dedicated professionals.


